

Bayesian independent t test - Writing up question

Dear friends,
I am comparing results from impedance cardiography (HR) between participants with low vs. high levels of antisocial behaviour. I finally finished up writing up a paper with these results, and I was wondering whether the following interpretation is correct? Any help/feedback will be much appreciated.
Ex.:
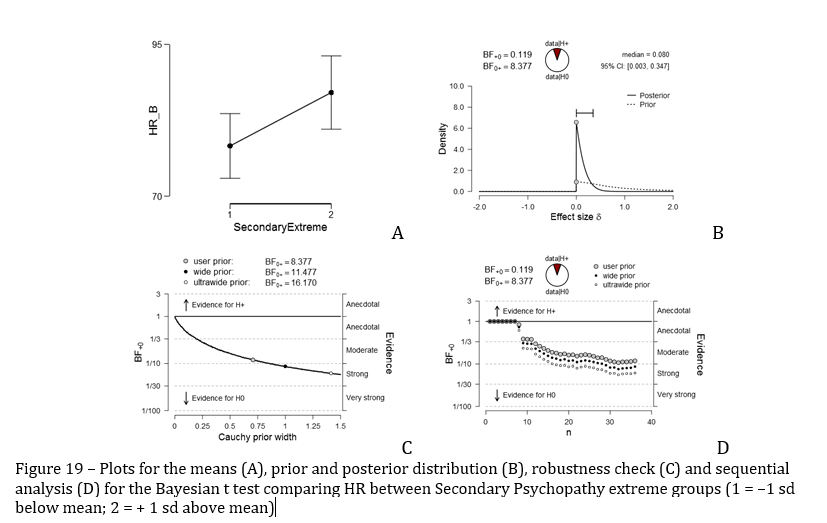
A different (unexpected) pattern has been observed for Secondary Psychopathy (Figure 19). Here, group 1 demonstrated lower HR (N = 98; M = 78.27, SD = 11.40, SE = 2.68) than did group 2 (N = 78; M = 87.07, SD = 12.93, SE = 3.04). A moderate to strong evidence towards the acceptance of the null hypothesis was detected (BF₀₋ = 8.377).
Thanks,
G
Comments
Hi G,
A few remarks:
1. The sequential plot stays at BF=1 until about the 10th participant. I assume the first 10 were all from the same condition? Might be good to state explicitly (JASP assumes the participant came in in the order of the rows).
2. Perhaps it is good to clarify that the BF is a relative measure of predictive success; here the alternative hypothesis predicts that the data go in the direction opposite to what is observed, and this means that the null hypothesis profits (relatively speaking).
3. People might be curious how much evidence there is if you were to conduct a two-sided test. It does not look to me like it would be terribly compelling, and that would support your case that although the data go somewhat in the unexpected direction, this tendency is insufficiently strong to discredit the null hypothesis.
Cheers,
E.J.
Hello, EJ. Thanks for your response.
1. Yes, in this particular case the first 10 participants were all in the same condition.
3. I decided to include in one table the values for both BF₀₋ and BF₊₀ for each domain compared with the Bayesian t test. This allows me to further explore, in the robustness check, how strong the evidence is and in favor of what.
Cheers, G.