

Visualisation of posterior odds = BF x prior odds

Hi there,
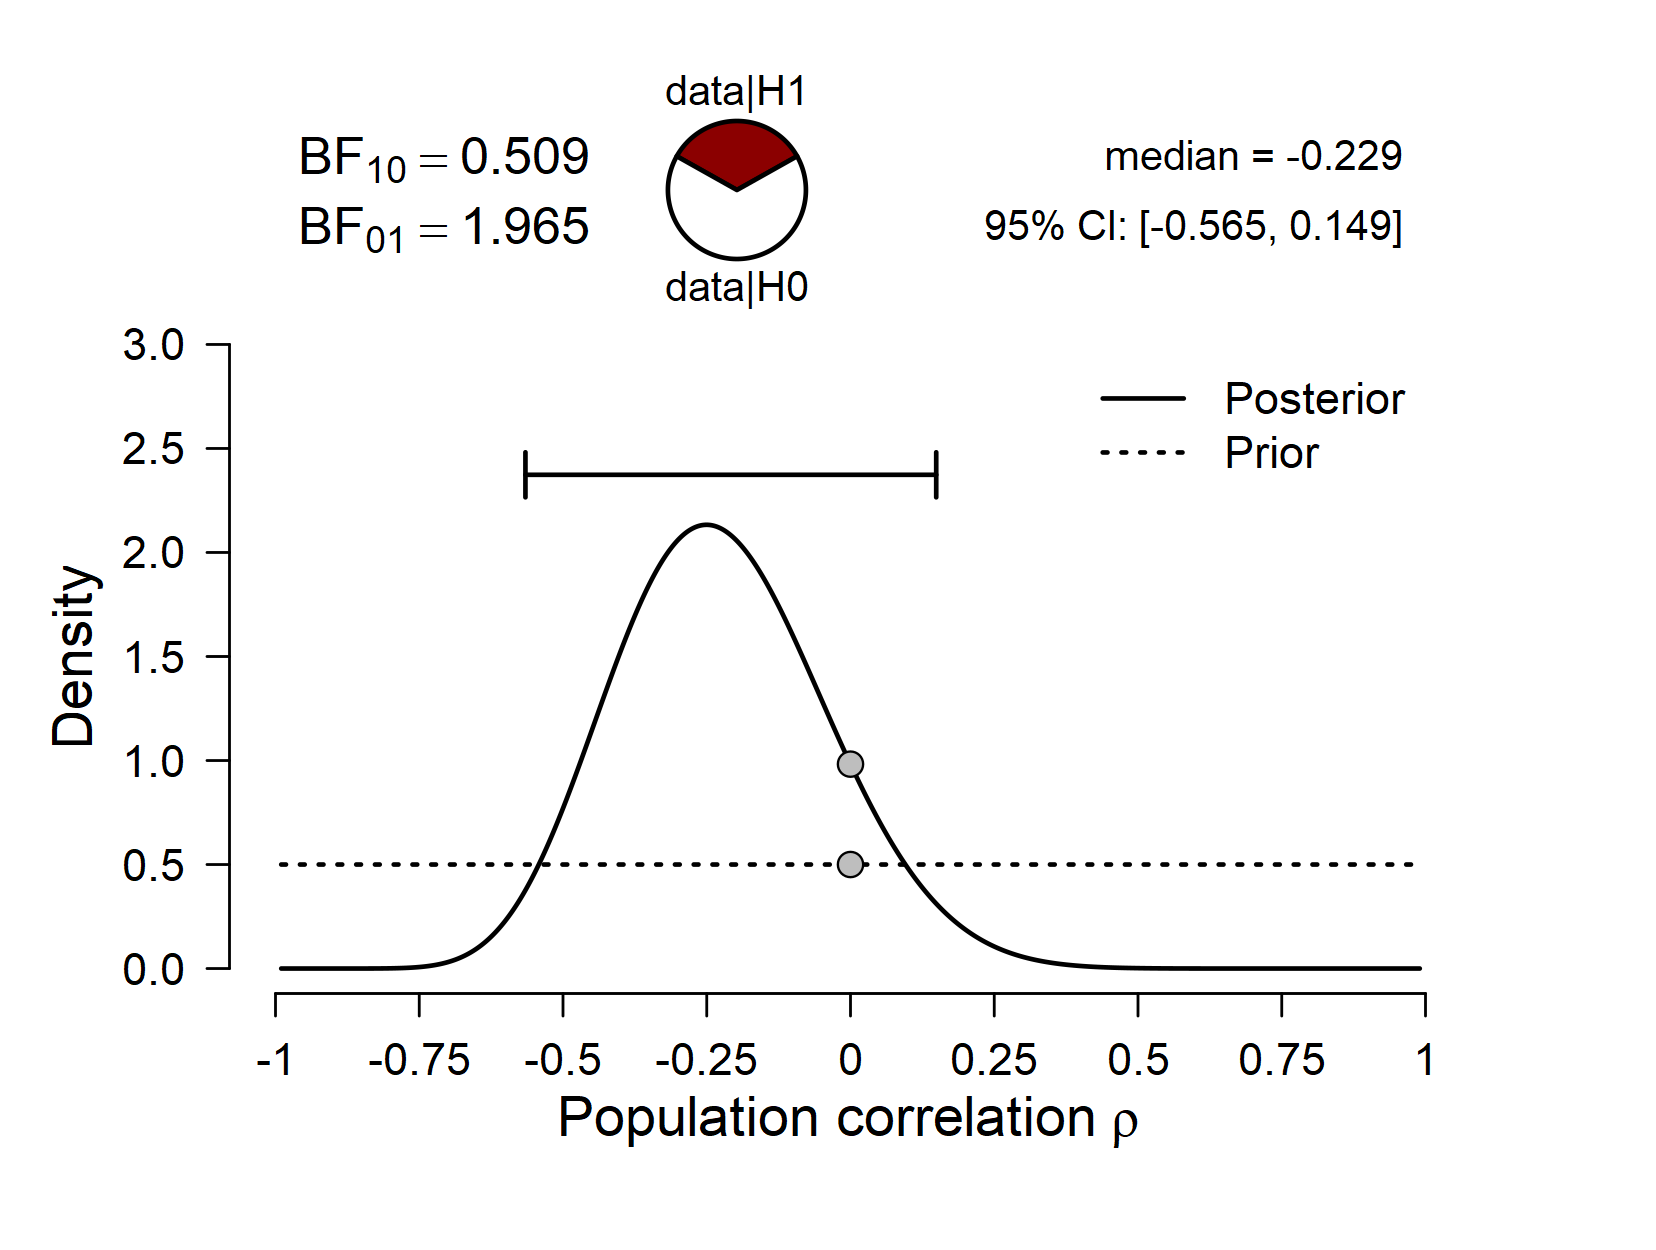
In the Prior and Posterior plots of the JASP output, it appears that if I were to take the denisty values of the two distributions at the grey dots (i.e., where the effect size is 0), and divide one by the other, I'd get the BF10 and BF01 values, depending on which way round I did the division. Am I correct in thinking this, or have I just got lucky when looking at this with a few datasets?
Thanks
Chris
Comments
Hi Chris,
That's exactly right. This is called the Savage-Dickey density ratio, and it is a convenient way to "see" a Bayes factor for H0 vs H1 without needing to compute the prior predictive adequacy for H0 and H1 separately. See for instance http://www.ejwagenmakers.com/2010/WagenmakersEtAlCogPsy2010.pdf
Cheers,
E.J.