

Accuracy and stability estimation - network analysis

I have to questions. The first one is ...
Can someone explain to me whether it is possible to calculate CS- coefficient? I mean centrality stability coefficient.
The second... How should I interpret this graph? What's the meaning of the black and red line, and gray area?
Comments
Hi MariaSz,
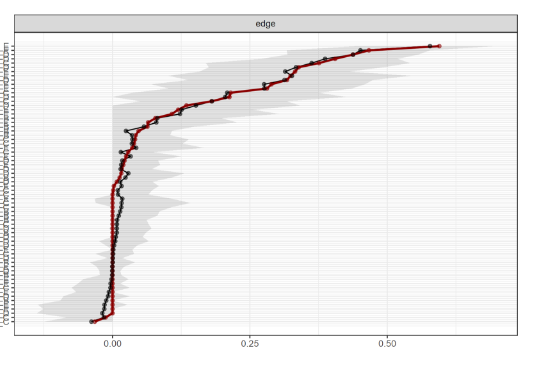
It appears that the legend labels disappeared! Here a screenshot of a smaller example:
So the red line indicates the sample edge strength, the black line indicates the mean of the bootstrapped edge strengths. The grey area shows a 95% confidence interval (obtained from the bootstraps).
I'm not completely sure what you mean by CS-coefficient, you could assess how stable the centrality coefficients are when dropping a % of people (change bootstrap type to "Case" and enable "Centrality" under "Statistics" in the bootstrap panel). The should produce a graph like this:
Let me know if you have any other questions!
Cheers,
Don
Dear Don,
thank you for your response. I meant centrality stability coefficient.
I followed your instructions and the program produced the following graph. What does it mean for me? Is it acceptable for me?