Same credible intervals, however, for different factors
Hello everyone,
Beforehand, For my masterthesis, I conducted a field study. The following study design was chosen: 2 experimental groups. Each participant of each group experienced two different systems. Participants of group 1 first experienced system 1 and then system 2, particpants of group 2 first experienced system 2 and afterwards system 1. Trust and Mistrust ratings were collected after each system was experienced. So for group 1, each participant had 2 trust and mistrust ratings, respectively. The same for group 2, logically. Hence, trust and mistrust ratings are the independent variable. In order to eliminate effects due to the measurement time points or order of experienced systems, before starting the actual analysis, I calculated a bayesian repeated measures anova with two factors (Think of a 2x2 table with trial I and II as the measurement time point in columns and the group I and II as the order of system in rows( the cell of trial I and group I would be system 1, the cell of trial II and group I would be System 2. The same for group 2 but the other way around):
Factor 1 = Measurement time point with two levels, namely trial I and trial II
Factor 2 = Trust/Mistrust with two levels, namely trust and mistrust, of course.
Therefore, the four repeated measures cells are:
).Trial I & Trust, 2)Trial I & Mistrust, 3)Trial II & Trust, 4)Trial II & Mistrust
I added the between subject factor Group.
When the interaction effect of measurement time point * group on the mistrust and trust ratings is calculated, I get the outcome of the potential effect the order of systems had on the trust and mistrust ratings. So, it is compared, whether mistrust and trust ratings were different between the four the cells due to order.
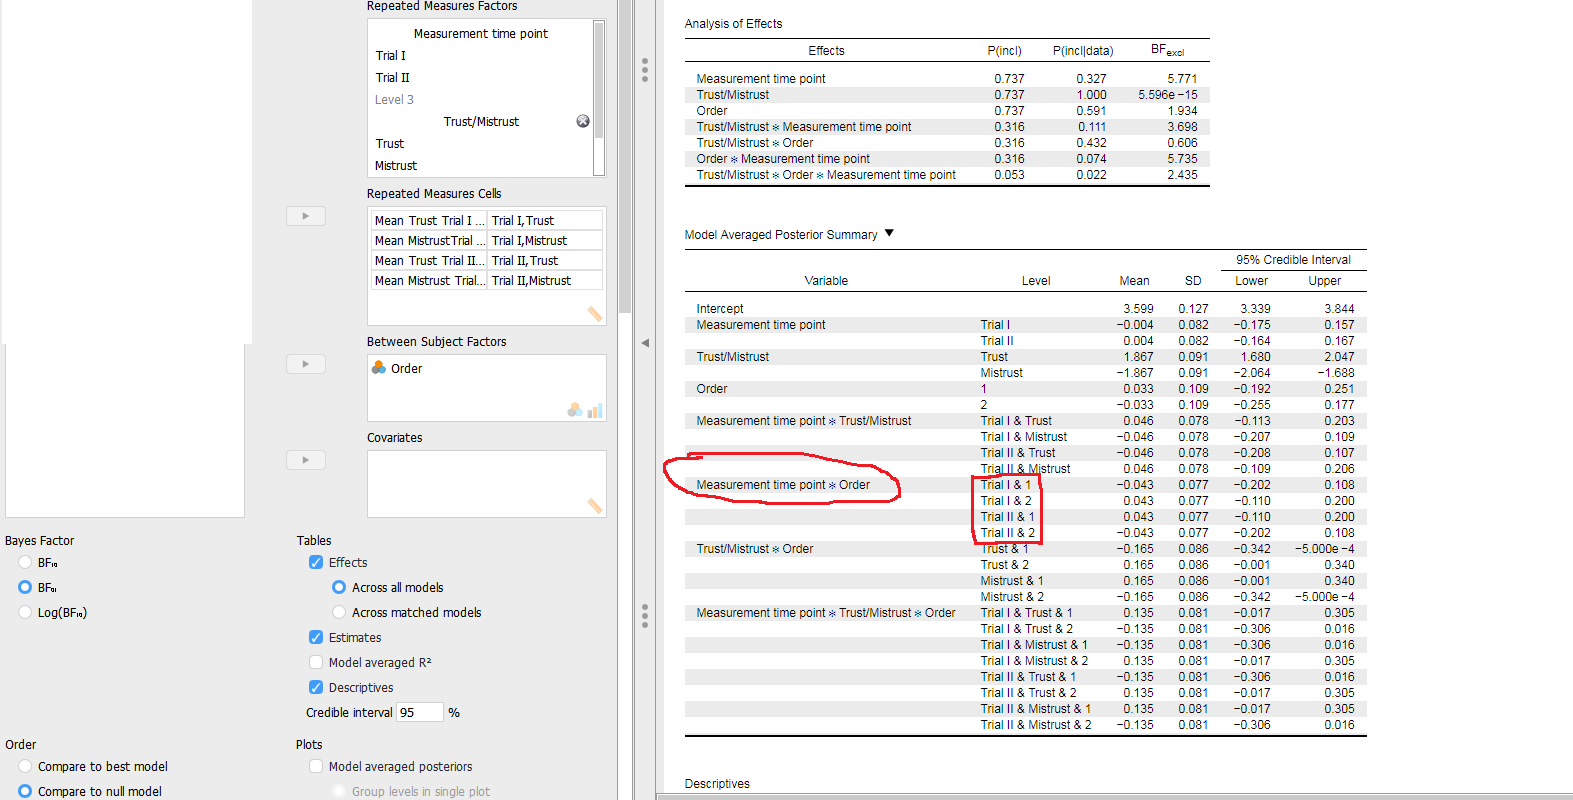
Now the actual problem I had: the output values of the credible intervals for mistrust and trust ratings are the same for system 1 in both groups and for system 2 in both groups:
For system 1 in group 1 (Trial 1 and group 1): (95% CI [-0.20; 0.11])
For system 1 in group 2 (Trial 2 and group 2) : (95% CI [-0.20; 0.11])
For system 2 in group 1 (Trial 2 and group 1): (95% CI [-0.11; 0.20])
For system 2 in group 2 (Trial 1 and group 2): (95% CI [-0.11; 0.20])
Is this usual? Is this due to the distribution of bayesian parameter estimation? By the way, how are the means and sd`s in the model averaged posterior summery built? I really do not understand this. I also checked my excel table and I could exclude a mistake there.
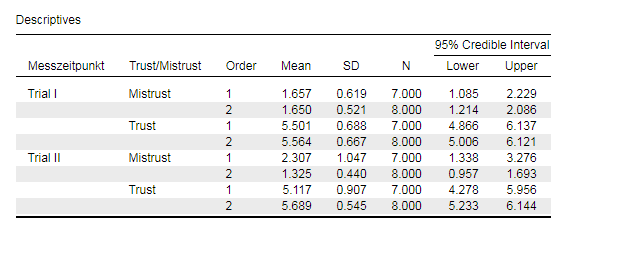
Considering that the means and sd`s of trust and mistrust ratings for System 1 of group 1 and 2 are nearly the same as well as the ratings for system 2 of group 1 and 2, would this be an explanation for the same credible intervals?
I really have the feeling, that there is a mistake, as the means are differing with a value of .5 approximately.
I hope you can understand the issue I tried to explain to you.
For safety, I added two screenshot of the jasp output, one of the descriptive
Kind regards,
Niklas


Comments
Hi Niklas,
I have the strong sense that something went wrong with the model specification, but I'll gladly pass this on to our ANOVA expert...more to follow.
Cheers,
E.J.
Hey EJ,
Yes, we thought so too that something went wrong with that but we could not find any mistake there. Do you already have an update?
Kind regards,
Niklas