Bayesian RM interpretation (specifically Model-Averaged Posterior Dist)
Hello, I'm not sure how to interpret the Model Averaged Posterior Distributions.
Study Context: I have a group made of young adults (YA) and older adults (OA) who have a pre- and a post-training measure on a variable.
SPSS Results: I get a statistically significant Session x Age interaction. Pairwise comparisons reveal that YA have a significant decrease on the measure following their training (yay!), while OA don't.
Bayesian RM Results (set to 'compared to the Null model'):
- If I want to look at my interaction only, I do (377.79 / 41.49). So does this mean that my interaction has a BF of 9.11, and therefore only shows moderate evidence for H1? Is it because only the YA seem to have a 'significant' change from pre- to post-training?
- Where can I find the breakdown of the age groups? With the classical statistics, I can find out how each age group performed and if it's significant. Is there an equivalent here?
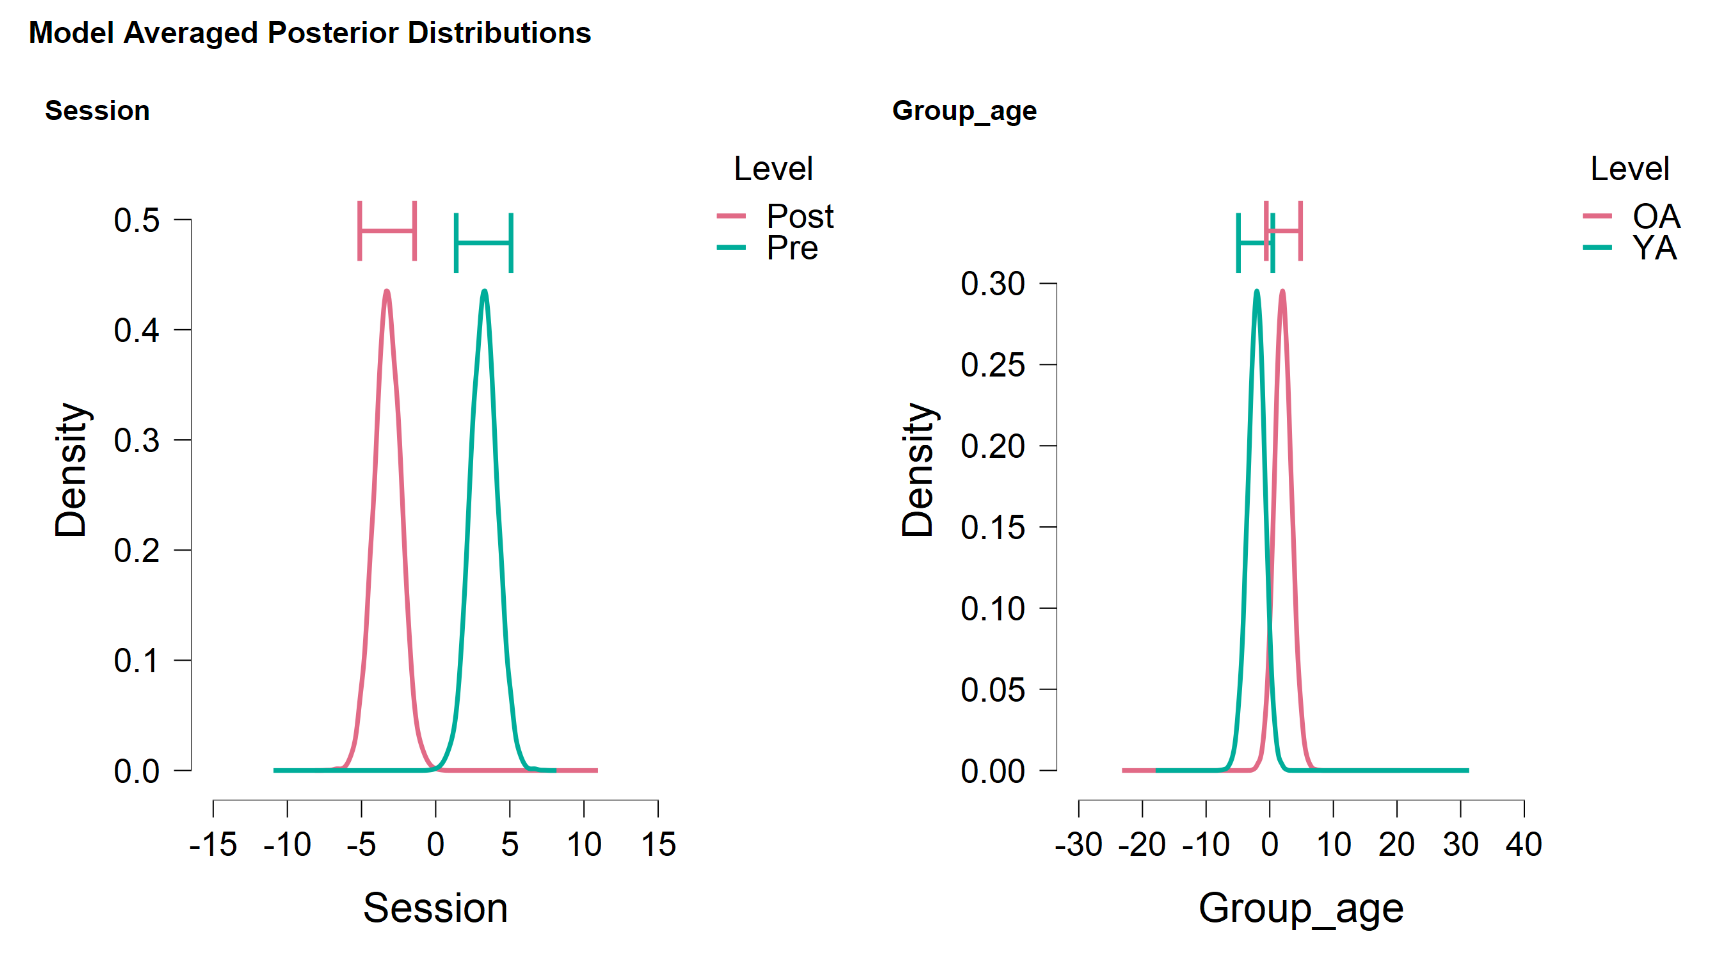
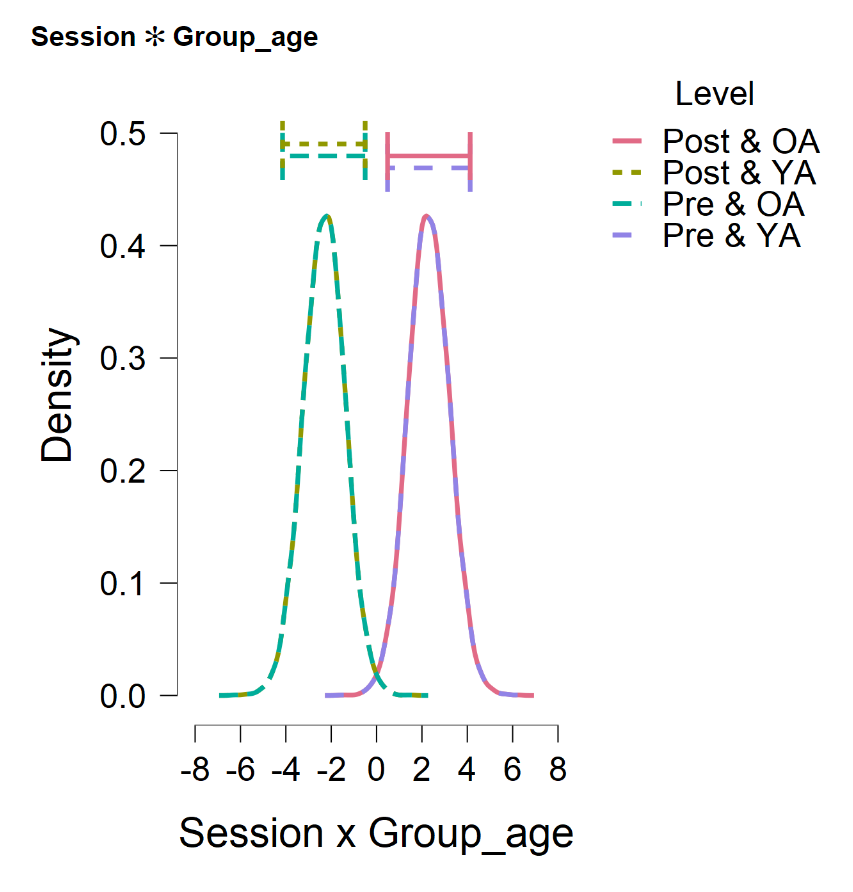
- I have difficulty interpreting the Model Averaged Post Dist graphs. (a) What is the Density? Where are these values from? (b) Other than the credible intervals in the Model Averaged Posterior Summary table, I don't understand how the other elements are mapped out on the distributions. It looks like the means are the peaks of the curves on the X-axis. Why are the means all so similar? (c) In the Session x Age graph, why does the Pre-OA and Post-YA overlap? Their performances are vastly different.
I know I'm asking a lot, I really appreciate any help I can get.
Cheers


Comments
This post can be deleted, I have since found answers to many of the questions.
Thanks. I also noticed that the png files are broken, as they were on an earlier post. Maybe the platform does not like png files....
E.J.