

Interpretation Statistics

I want to evaluate a certain score over different time-points (for different subjects). Normally I would go with a repeated measures anova, but because we have missing data I used a linear mixed model. I am using JASP, but I have some troubles with the interpretation, as I do not know that much about statistics.
The dependent variable is the score obtained in the test, the fixed variable is the timepoint (6 timepoints: baseline, 24h, 3d, 1 week, 3 weeks, 5 weeks) and the random effect grouping factor is the subject (only 6 subjects).
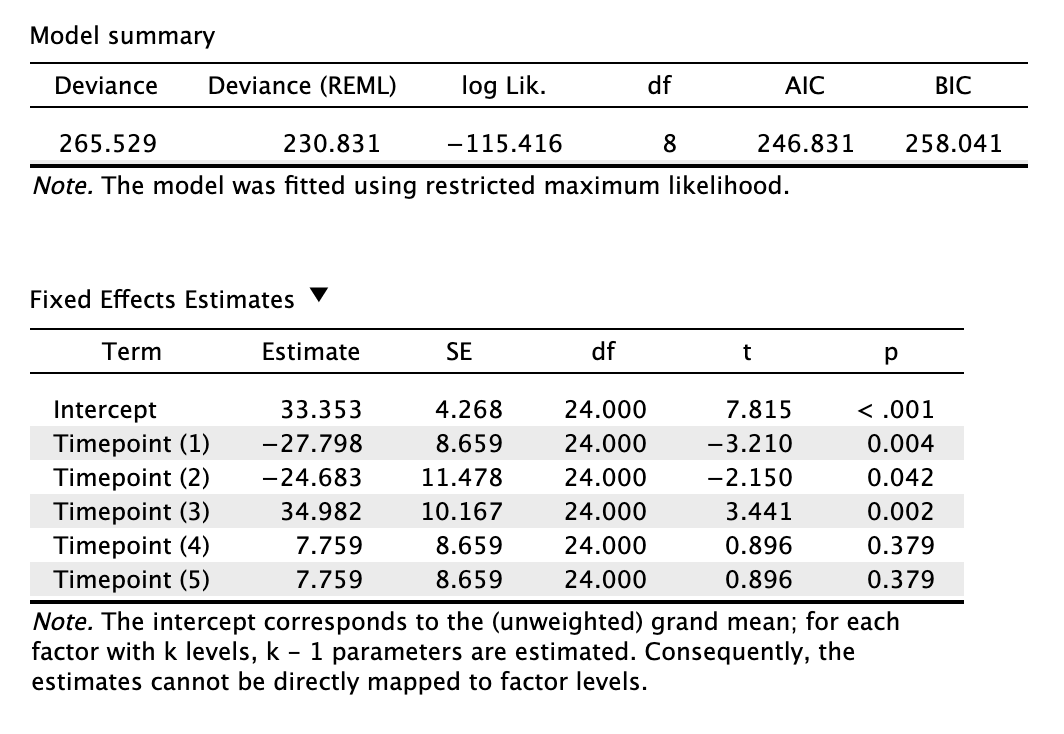
This is what I obtained for fixed effects estimates. I would like to compare the first timepoint (baseline) with the rest of the timepoints and see if there is a significant variance. But here I am not sure what the intercept means, as it seems that the last timepoint is being compared to the rest.
Can someone help me interpret this results?
Comments
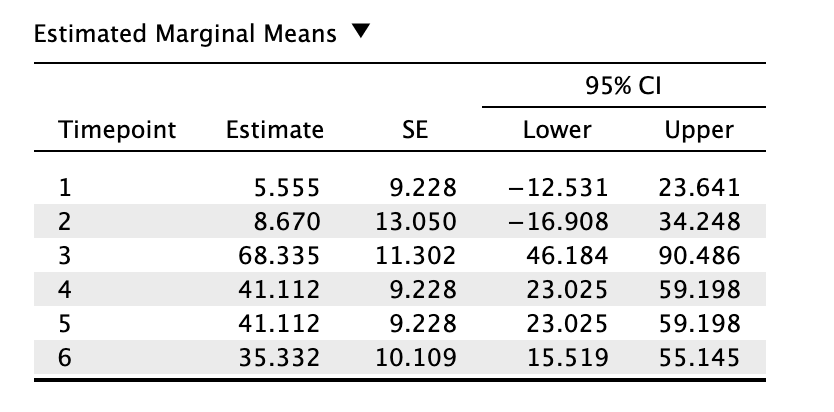
As the note says, the intercept corresponds to the unweighted grand mean, that is the mean of all the design cells. In your case, that is the mean of the estimated marginal means for each time point.
To compare the other time points against the baseline, you need to run the corresponding follow-up tests through "Specify contrasts". That is, you need to set up five contrasts. In each contrast time point 1 gets a 1 and each of the other time points gets a -1.
Hello, I'm also having the same problem.
Can you help me ? What value to specify in contrast
The sum of the contrasts should to be 0. So you might want to use something like -1 in the top row, 0 in the middle row, and 1 in the bottom row. Or -0.5, -0.5, 1. Or something like that.
Hi @Leire_Iglesias,
there are already suggestions from @henrik_singmann, but taking a look here might help if you're interested in contrasts:
I am attaching a screenshot where I used data similar to yours and specified the custom contrasts to obtain the same values of the "Fixed Effects Estimates" table, which result as comparisons between a single Timepoint and the set of the remaining Timepoints.
Example:
Contrast 1 (baseline vs. 24h - 3d - 1 week - 3 weeks - 6 weeks)
Contrast 2 (24h vs. baseline - 3d - 1 week - 3 weeks - 6 weeks)
Contrast 3 (3d vs. baseline - 24h - 1 week - 3 weeks - 6 weeks)
etc.
With the personalized table of contrasts you can set the contrasts for the comparisons you have decided in designing your research.
Cheers,
Maurizio