

NAs are not allowed in subscripted assignments

Hi! I am analyzing my data from a web experiment, and when I try to run this command:
sst_mt <- mt_import_mousetrap(df_sst, xpos_label = 'mouse_sst.x', ypos_label = 'mouse_sst.y', timestamps_label = 'mouse_sst.time')
sst_mt$data$pos_var <- apply(sst_mt$trajectories[,,"xpos"],1,var,na.rm=TRUE) + apply(sst_mt$trajectories[,,"ypos"],1,var,na.rm=TRUE)
# Check if there are trials with 0 variance (i.e., all positions are identical)
table(sst_mt$data$pos_var==0)
# Only keep trials where positions varied
sst_mt <- mt_subset(sst_mt, pos_var>0)
sst_mt <- mt_time_normalize(sst_mt)
sst_mt <- mt_align_start(sst_mt)
sst_mt <- mt_derivatives(sst_mt)
sst_mt <- mt_measures(sst_mt)
I get the following error message:
Error in current_dev_ideal[to_flip_dev_ideal] <- -current_dev_ideal[to_flip_dev_ideal] :
  NAs are not allowed in subscripted assignments
as you can see, I have eliminated trials with no movement. Any help would be greatly appreciated!
Comments
Hello,
I think you have to remove all the NA values in your data set. Are you sure you have removed all of the NA variables? If so, there should be no problem. 😊
Hello
Despite removing all positions as spesified above like a.g.leontiev did I'm getting the same error. Can you explain how remove all the NAs from the mousetrap object @GoSugar please? Any help would be greatly appreciated!
Hi there,
I also would speculate that the problem is due to missing values (NAs), probably missing values that are already occurring in the raw dataset (df_sst).
Usually, mt_import_mousetrap should to a good job at checking for missing values and throwing warning messages if there are any. Do you get any warning messages after running mt_import_mousetrap with your dataset and, if so, could you post them here?
Best,
Pascal
I have re-run everything and it worked smoothly without throwing any error. I guess i just had to restart R?
I also have an (unrelated) question. Is there a way to calculate measures not over ALL trials, but let's say first half of the trials? Thank you so much!
Great to hear things are running smoothly now!
Currently, there is no option in mousetrap that can calculate measures for only parts of the trial. However, depending on what measure you are interested in, functions like mt_deviations and mt_derivatives calculate deviatons from the idealized trajectory and velocity/accelerations for each time point, so you might use this as a starting point if you want to calculate a measure for a certain time point / part of the trial.
Hi Pascal thanks for getting back to me. This task is a flanker task run in Qualtrics, where the participants have to press start at the bottom of the screen then click on the top left or right depending which way the middle arrow is facing. I had to do a lot of preprocessing to get it into a format that is importable to mousetrap. I'm having issues with my code. When I just do mt_align there are no errors but the agregate trajectories aren't right:
mt_data <- mt_import_wide(mt_data1)
mt_data <- mt_count(mt_data, save_as = "data")
# Look at number of of recorded positions
table(mt_data$data$nobs)
# Only keep trials with more than 2 recorded positions
mt_data <- mt_subset(mt_data, nobs > 2)
# Calculate variance of positions for each trial
mt_data$data$pos_var <- apply(mt_data$trajectories[,,"xpos"],1,var,na.rm=TRUE) + apply(mt_data$trajectories[,,"ypos"],1,var,na.rm=TRUE)
# Check if there are trials with 0 variance (i.e., all positions are identical)
table(mt_data$data$pos_var==0)
# Only keep trials where positions varied
mt_data <- mt_subset(mt_data, pos_var>0)
mt_data <- mt_derivatives(mt_data)
mt_data<-mt_measures(mt_data, use = "trajectories",save_as="measures",
dimensions = c("xpos", "ypos"), timestamps = "timestamps",
verbose = FALSE)
mt_data <- mt_time_normalize(mt_data)
mt_data <- mt_spatialize(mt_data)
mt_data$trajectories[,,"ypos"] <- (-mt_data$trajectories[,,"ypos"])
mtdata1<-mt_align(mt_data)
mt_plot(mtdata1, use="trajectories", color="subj")
mt_plot_aggregate(mt_data, use="sp_trajectories", color="condition")
However as you can see this isn't right. If I just do mt_plot_aggregate(mt_data, use="trajectories", color="condition")
If I try to specify the start and end to something meaningful from the first figure :
mtdata1<-mt_align_start_end(mt_data, use = "trajectories", save_as = use,
dimensions = c("xpos", "ypos"), start = c(1250, -1250), end = c(0,0),
verbose = FALSE)
I get the following error:
Error in create_results(data = data, results = trajectories, use = use, : object 'use' not found
In addition: Warning message: In mt_align_start_end(mt_data, use = "trajectories", save_as = use, : NaN/Inf/-Inf values returned in some trials for the dimension xpos as their start and end coordinate was identical.
Where as if I just specify mt_align further mtdata<-mt_align( mt_data, use = "trajectories", save_as = use, dimensions = c("xpos", "ypos"), coordinates = c(-1200,1200,-2500,0), align_start = TRUE, align_end = TRUE, align_side = "left", verbose = FALSE)
Error in trajectories[flip, , dimensions[1]] <- ((trajectories[flip, , : NAs are not allowed in subscripted assignments
How can I still have NAs when I've removed trials without variance or <2positions? And why does mt_align work but not mt_align_start(end)
I really appreciate all your help. Thanks so much,
Polly
I meant not in the first part of a trial, but let's say first 100 of ALL trials :)
Oh Sorry there isn't an obvious error on import
>mt_data <- mt_import_wide(mt_data1)
No mt_id_label provided. A new trial identifying variable called mt_id was created.
No pos_ids provided. The following variables were found using grep:
397 variables found for timestamps.
397 variables found for xpos.
397 variables found for ypos.
Regarding @a.g.leontiev's question:
I am not completely sure what you mean with "I meant not in the first part of a trial, but let's say first 100 of ALL trials".
Do you mean you would only like to select a subset of trials for your analysis? If so, you could do this either using the basic R subset function before importing your data into mousetrap or using mt_subset afterwards. Assuming you have a variable that is your trial count (e.g., "count_trial"), the command would simply look like:
raw_data <- subset(raw_data, count_trial<=100)or:
mt_data a- mt_subset(mt_data, count_trial<=100)Regarding @P_Barr's question:
I think that there are still some problematic trials in your dataset that need to be excluded. Specifically, there is the above warning that you quote:
In addition: Warning message: In mt_align_start_end(mt_data, use = "trajectories", save_as = use, : NaN/Inf/-Inf values returned in some trials for the dimension xpos as their start and end coordinate was identical.
The warning suggest that in some trials the start and end point is identical which, if I understand your setup correctly, should not be possible (if participants click a start button at the bottom and then one of the response buttons at the top of the screen). One explanation for this that I can think of is that your task uses a time limit after which a trial is automatically aborted (i.e., there are trials without response possible). If so, these trials need to be excluded before importing them into mousetrap.
Hi Pascal,
You are correct its not possible to have the same start and end position as they have to click start in the bottom center of the screen and then a left or right button at the top corners.
I don't think we included a timeout- participants are forced to click a response button to see the next trial. We did include an error message after they clicked a response button if they started too late (>800ms) or responded too late (>5000ms). I have excluded these prior to import (wide) and now the trajectories seem to automatically have an aligned start and end but I'm still having weird aggregate plotting issues:
mt_data1<-read.csv ("MT_data5.csv", header = TRUE, sep = ',')
# remove too long/timeout responses prior to import(https://forum.cogsci.nl/discussion/comment/20455#Comment_20455)
mt_data1 <- mt_data1[ which(mt_data1$init.time <800 & mt_data1$response_latency2<5000), ]
#import to MT
mt_data <- mt_import_wide(mt_data1)
mt_data <- mt_count(mt_data, save_as = "data")
# Look at number of of recorded positions
table(mt_data$data$nobs)
# Only keep trials with more than 2 recorded positions
mt_data <- mt_subset(mt_data, nobs > 2)
# Calculate variance of positions for each trial
mt_data$data$pos_var <- apply(mt_data$trajectories[,,"xpos"],1,var,na.rm=TRUE) + apply(mt_data$trajectories[,,"ypos"],1,var,na.rm=TRUE)
# Check if there are trials with 0 variance (i.e., all positions are identical)
table(mt_data$data$pos_var==0)
# Only keep trials where positions varied
mt_data <- mt_subset(mt_data, pos_var>0)
mt_data$trajectories[,,"ypos"] <- (-mt_data$trajectories[,,"ypos"])
mt_data <- mt_derivatives(mt_data)
mt_data<-mt_measures(mt_data, use = "trajectories",save_as="measures", dimensions = c("xpos", "ypos"), timestamps = "timestamps", verbose = FALSE)
mt_data <- mt_time_normalize(mt_data)
mt_data <- mt_spatialize(mt_data)
mt_plot(mt_data, use="trajectories", color="condition")
(as you can see it seems to be more aligned now)
mt_plot_aggregate(mt_data, use="sp_trajectories",color="condition")
mt_plot_aggregate(mt_data, use="trajectories",+ color="condition")
Warning message:
In mt_reshape(data = data, use = use, use_variables = use_variables, :
Trajectories differ in the number of logs. Aggregate trajectory data may be incorrect
If I try and do align_start_end (which I don't think I need to as it seems to be aligned) I get the same error message:
mtdata1<-mt_align_start_end(mt_data, use = "trajectories", save_as = use,dimensions = c("xpos", "ypos"), start = c(1250, -1250), end = c(0,0), verbose = FALSE)
Error in create_results(data = data, results = trajectories, use = use, : object 'use' not found
In addition: Warning message:
In mt_align_start_end(mt_data, use = "trajectories", save_as = use, : NaN/Inf/-Inf values returned in some trials for the dimension xpos as their start and end coordinate was identical.
As always I really appreciate your help and any ideas
Hi there,
I have the following ideas regarding the issues you mentioned above:
1) Flipping trajectories
In your preprocessing code, I did not see a step where you flip trajectories that ended on the right option to the left. If you do not do this, the resulting aggregate trajectory plot might be misleading as it aggregates trajectories that end on the left and end on the right option.
2) Aggregate trajectory plot:
To create the aggregate trajectory plot, you use:
mt_plot_aggregate(mt_data, use="trajectories", color="condition")However, when plotting aggregate trajectories, you usually cannot use the raw trajectories as the number of recorded positions varies between trajectories (which is also why you get the warning message you quoted above: "Trajectories differ in the number of logs. Aggregate trajectory data may be incorrect"). Therefore, the resulting plot looks quite weird. Instead, you could use the time-normalized trajectories:
mt_plot_aggregate(mt_data, use="tn_trajectories", color="condition")3) Start end alignment
The warning message you quoted "NaN/Inf/-Inf values returned in some trials for the dimension xpos as their start and end coordinate was identical." suggests that in some trials the x coordinate of the start and end position was identical (the y coordinate might vary). In this case, the function cannot normalize the trajectory start and end points. I don't know if an identical start and end x coordinate is possible in your setup, but if so, it might not make sense to use this function.
Hi!
I am unfortunately having this issue again:#### 100 ms ####
m100msstop <- subset(mydata, vol == 1 & ssd == 0.1)

mt_sst <- mt_import_mousetrap(

+   m100msstop,

+   xpos_label = "mouse_sst.x",

+   ypos_label = "mouse_sst.y",

+   timestamps_label = "mouse_sst.time"

+

+ )

There were 22 warnings (use warnings() to see them)

table(mt_sst$data$nobs)

mt_sst <- mt_count(mt_sst, save_as = "data")

table(mt_sst$data$nobs)


 10  13  14  16  18  19  20  22  23  24  25  26  27  28  29  30  31  32  33  34  35  36  37  38  39  40  41  42  43  44  45  46  47  48  49  50

  2   1   1   1   4   1   5   2   3   1   8  11   8   6   9   9  10   6  10  13  19  20  17  14  28  12  20  20   8  20  17  18  21  23  15  16

 51  52  53  54  55  56  57  58  59  60  61  62  63  64  65  66  67  68  69  70  71  72  73  74  75  76  77  78  79  80  81  82  83  84  85  86

 24  19  16  22  23  15   6  15   7  12  10   7   9   7   4   5   6   3   5   3   4   2   3   6   6   1   3   4   8   4   4   9   5   8   5  12

 87  88  89  90  91  98  99 109 212 214 215

 15   7  62 732   1   1   1   1   1   6  39


mt_sst <- mt_subset(mt_sst, nobs > 2)

mt_sst$data$pos_var <- apply(mt_sst$trajectories[,,"xpos"],1,var,na.rm=TRUE) + apply(mt_sst$trajectories[,,"ypos"],1,var,na.rm=TRUE)

> table(mt_sst$data$pos_var==0)


FALSE  TRUE

 1453   114

mt_sst <- mt_subset(mt_sst, pos_var>0)

# Calculate mouse-tracking derivatives for each position (distance, velocity, acceleration)
mt_sst <- mt_derivatives(mt_sst)


# Calculate standard mouse-tracking measures

> mt_sst <- mt_measures(mt_sst)

Error in current_dev_ideal[to_flip_dev_ideal] <- -current_dev_ideal[to_flip_dev_ideal] :

  NAs are not allowed in subscripted assignments


# Demonstrate that sum of distances corresponds to total_dist measure

table(rowSums(mt_sst$trajectories[,,"dist"],na.rm=TRUE)-mt_sst$measures$total_dist)

< table of extent 0 >


# Set distances for timestamps beyond 600 ms to 0

mt_sst$trajectories[,,"dist"][mt_sst$trajectories[,,"timestamps"]<0.1] <- 0

mt_sst$measures$total_dist_100 <- rowSums(mt_sst$trajectories[,,"dist"],na.rm=TRUE)

stop_distance_100 <- mt_aggregate_per_subject(

+   mt_sst,

+   use="measures",

+   use_variables=c("total_dist_100"),

+   subject_id="File"

+ )

Error in dataset[, mt_id] <- rownames(dataset) :

  incorrect number of subscripts on matrix
Any help would be greatly appreciated @Pascal . As you can see above, I tried removing trials with no movement, but I still get the same problem.
Hi there,
I have a questions to better understand the issue. In your code and output it says after running mt_import_mousetrap:
Have you inspected these warning messages and could post them here?
The error messages further down in your code (" NAs are not allowed in subscripted assignments") suggest that some trajectories might have a different number of recorded x/y-positions. This might already be in issue in the raw data, which could be raised by the wawrning messages in mt_import_mousetrap.
Best,
Pascal
@Pascal Thank you for the prompt response. Here is the output, and I think you are correct, but how we get rid of it later so that we can still calculate stopping distance for a given time delay?
Hi there,
if you only want to exclude the probelamtic trials, one "quick and dirty" solution could be to just exclude the ids that were reported directly after mt_import_mousetrap with mt_subset:
m100msstop <- mt_subset(m100msstop,
  !mt_id %in% c("id0371", "id0688", "id1092", "id0313", "id0321", "id0371", "id0374", "id0379", "id0677", "id0688", "id0824", "id0825", "id0933", "id0934", "id0939", "id1092", "id1432", "id1437", "id1439", "id1460", "id1466", "id1467")
)
However, it would probably be better to explore why this warning occurs by closer inspecting the raw data and the tool that was used to collect that mouse-tracking data.
Best,
Pascal
Hi @Pascal ,
I hope you are well and safe. :)
This is my first time analysing mousetracking data, and I am having issues with NA values in my dataset. Below is my step-by-step approach to the analysis as I don't know what I am doing wrong.
gorilla.mt<-mt_import_long(gorilla.traj,xpos_label="x_normalised",ypos_label="y_normalised",timestamps_label="time_stamp",
                           mt_id_label= c("spreadsheet_row", "id_no"), reset_timestamps = FALSE)
Then I get a warning message:
gorilla.mt<-mt_measures(gorilla.mt, use = "trajectories",save_as="measures",
                        dimensions = c("xpos", "ypos"), timestamps = "timestamps",
                        verbose = FALSE)
With the above, I get the following warning:
then I load the behavioural data:
I then add columns to the dataset:
gorilla.traj.rectangles <- PofflishMousetrackingFile
matrix.contents<-c("click", "leftrecording","rightRecording")
matrix.data<-filter(gorilla.traj.rectangles, zone_name %in% matrix.contents)
matrix.data<-matrix.data[1:length(matrix.contents),c("zone_x_normalised","zone_y_normalised","zone_width_normalised","zone_height_normalised")]
rectangles<-as.matrix(sapply(matrix.data, as.numeric))
rectangles<-unname(rectangles)
When I try to plot the trajectories, there is a third condition (i.e. NA) which should not be there:
mt_plot(gorilla.mt,use="trajectories",use2="data",x="xpos",y="ypos",points=TRUE,color="condition")+
  mt_plot_add_rect(rect=rectangles,color="black",fill="NA",alpha=0.2)+
  xlab("X axis position")+
  ylab("Y axis position")+
  theme_classic()
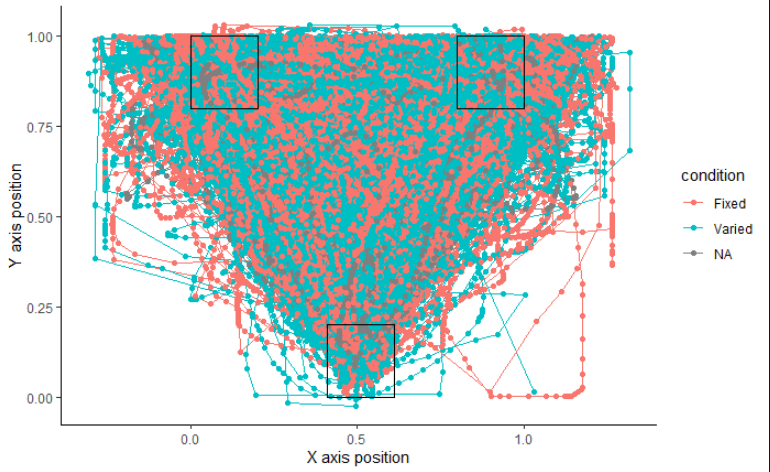
When I try to plot according to TypeReader, it shows NA instead of Above.:
mt_plot(gorilla.mt,use="trajectories",use2="data",x="xpos",y="ypos",points=TRUE,color="TypeReader")+ mt_plot_add_rect(rect=rectangles,color="black",fill="NA",alpha=0.2)+ xlab("X axis position")+ ylab("Y axis position")+ theme_classic()With the above, I get the following warning:
The above does not look correct.
in the plot above, NA is no longer present, but neither is Above
My apologies for such lengthy post!
This is my first time doing mousetracking analysis and I am not super skilled at R.
Thanks!
Hi @Pascal ,
I hope you are well and safe. :)
This is my first time analysing mousetracking data, and I am having issues with NA values in my dataset. Below is my step-by-step approach to the analysis as I don't know what I am doing wrong.
gorilla.mt<-mt_import_long(gorilla.traj,xpos_label="x_normalised",ypos_label="y_normalised",timestamps_label="time_stamp",
                           mt_id_label= c("spreadsheet_row", "id_no"), reset_timestamps = FALSE)
Then I get a warning message:
gorilla.mt<-mt_measures(gorilla.mt, use = "trajectories",save_as="measures",
                        dimensions = c("xpos", "ypos"), timestamps = "timestamps",
                        verbose = FALSE)
With the above, I get the following warning:
then I load the behavioural data:
I then add columns to the dataset:
gorilla.traj.rectangles <- PofflishMousetrackingFile
matrix.contents<-c("click", "leftrecording","rightRecording")
matrix.data<-filter(gorilla.traj.rectangles, zone_name %in% matrix.contents)
matrix.data<-matrix.data[1:length(matrix.contents),c("zone_x_normalised","zone_y_normalised","zone_width_normalised","zone_height_normalised")]
rectangles<-as.matrix(sapply(matrix.data, as.numeric))
rectangles<-unname(rectangles)
When I try to plot the trajectories, there is a third condition (i.e. NA) which should not be there:
mt_plot(gorilla.mt,use="trajectories",use2="data",x="xpos",y="ypos",points=TRUE,color="condition")+
  mt_plot_add_rect(rect=rectangles,color="black",fill="NA",alpha=0.2)+
  xlab("X axis position")+
  ylab("Y axis position")+
  theme_classic()
When I try to plot according to TypeReader, it shows NA instead of Above.:
mt_plot(gorilla.mt,use="trajectories",use2="data",x="xpos",y="ypos",points=TRUE,color="TypeReader")+
  mt_plot_add_rect(rect=rectangles,color="black",fill="NA",alpha=0.2)+
  xlab("X axis position")+
  ylab("Y axis position")+
  theme_classic()
https://forum.cogsci.nl/uploads/780/42QI8B63POT1.pngWith the above, I get the following warning:
mt_plot_aggregate(gorilla.mt, use="tn_trajectories",x="xpos", y="ypos", color="condition",subject_id="id_no")+theme_classic()The above does not look correct.
https://forum.cogsci.nl/uploads/192/WXMEGMPA3K1C.pngin the plot above, NA is no longer present, but neither is Above
My apologies for such lengthy post!
This is my first time doing mousetracking analysis, and I am not super skilled at R.
Thanks!
Hi there,
before answering your question, I would like to point out that I am not familiar with the Gorilla data format so I can probably only give you more general advice on how to format your data in a way that they are processed by mouestrap correctly.
The general logic when you import data into mousetrap is that you import all the data you need already in the
mt_import_longstep and do not add variables to the data part afterwards (I am not saying that this is not possible but if you do it the other way this should ensure all data are assigned to the correct trajectory).In your case this would mean that you should merge gorilla.mt and gorilla.response.attempts datasets (using the trial identifying variable(s)). In the resulting dataset, each response variable would then be stretched across the complete trial (with a constant value per trial). This dataset could then be imported with mt_import_long in the same way you are doing it above.
Regarding the aggregate plots, I can only speculate but I would guess that you have both trajectories in the data that end on a option on the left and that end on an option on the right which is why the aggregate looks weird and somewhere in between. Usually you you remap all trajectories before plotting so that all trajectories end on the same response option side.
Hope this helps!
Best,
Pascal
Hi @Pascal ,
Thank you for your response!
I have followed your advice and added the additional columns prior to importing the data as a mousetrap object. However, I am having some odd issues now.
Below is the structure of the mousetracking and behavioural data together:
gorilla.mt<-mt_import_long(gorilla.traj, xpos_label="x_normalised", ypos_label="y_normalised", timestamps_label="time_stamp",
                           mt_id_label= c("id_no", "spreadsheet_row"))
the above throws the following warning:
When I check the trajectories, I can see that there are lots of NAs:
I don't quite understand why there are so many NAs since there doesn't seem to be NAs in the raw data.
gorilla.mt<-mt_measures(gorilla.mt, use = "trajectories",save_as="measures",
                        dimensions = c("xpos", "ypos"), timestamps = "timestamps",
                        verbose = FALSE)

gorilla.mt <-mt_count(gorilla.mt, save_as = "data")
gorilla.mt <- mt_subset(gorilla.mt, nobs > 2)
gorilla.mt$data$pos_var <- apply(gorilla.mt$trajectories[,,"xpos"],1,var,na.rm=TRUE) + apply(gorilla.mt$trajectories[,,"ypos"],1,var,na.rm=TRUE)
table(gorilla.mt$data$pos_var==0)
gorilla.mt <- mt_subset(gorilla.mt, pos_var>0)
There are 36 trials per participant, so not sure if the below make sense:
mt_aggregate(gorilla.mt, use="measures",use_variables=c("MAD", "AD"), use2_variables="medianGroupTemporary", subject_id="id_no") medianGroupTemporary <chr> MAD <dbl> AD <dbl> Above 0.2274615 0.07535122 Below 0.2848648 0.09394984The above is obviously wrong. Now, the odd behaviour is: if I repeat the following steps immediately after:
this is the plot i get:
Why does it work the second time around, but not the first?
I have ey
oops, I accidentally didn't finish the above.
I have already cleaned the global environment and restarted R several times, but the above keeps happening.
Thank you once again, @Pascal :) I really appreciate your help!
Have a nice week!
Hi there,
regarding the question if nrow(gorilla.mt$data) = 1692 makes sense?
If you have 36 trials per participants, then you should have 47 participants in there as nrow should be the total number of trials in the data (i.e., number of participants * number of trials / participant).
Regarding the NAs: this is in general no reason to worry as mousetrap internally represents the trajectories in an array and has to fill up shorter trajectories with NAs up to the length of the longest trajectory in the data.
Regarding the odd plot: I think the explanation is the following: mt_remap_symmetric only works if you have a centered coordinate system - see documentation, e.g., here: http://pascalkieslich.github.io/mousetrap/reference/mt_remap_symmetric.html
This does not seem to be the case in your raw data. However, once you align your trajectories with mt_align_start(gorilla.mt), the function actually works (at least with regard to mirroring all trajectories that end on the right option to the left). So you should be able to reproduce the desired behavior when running the code once but first calling mt_align_start and then mt_remap_symmtetric.
Best,
Pascal
Hi @Pascal,
Thank you so much for your swift reply.
It is working now! Thank you for clarifying! It all makes sense now!
Cheers