

Descriptive Plots: How to stack bar graphs?

This program is amazing. I was wondering about a function in the
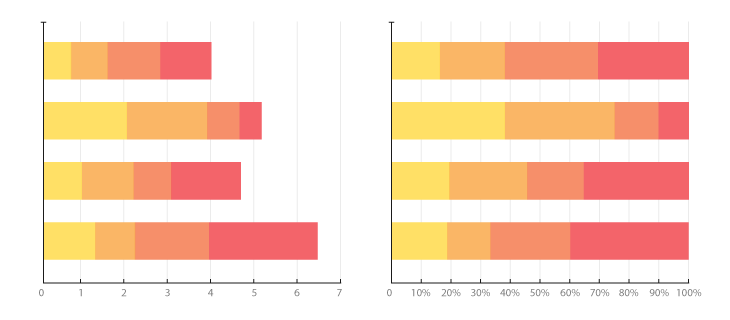
descriptive statistics part. Is it possible to stack values in a bar graph?
with group or scale option such as in the screenshot?
Instead of have a separate bar graph for each variable?
Comments
This is currently not possible. If you want to see this in a future version of JASP, please make a feature request at https://github.com/jasp-stats/jasp-issues. See https://jasp-stats.org/2018/03/29/request-feature-report-bug-jasp/ for some more information on how to do this.