

Plotting Robustness Check in R

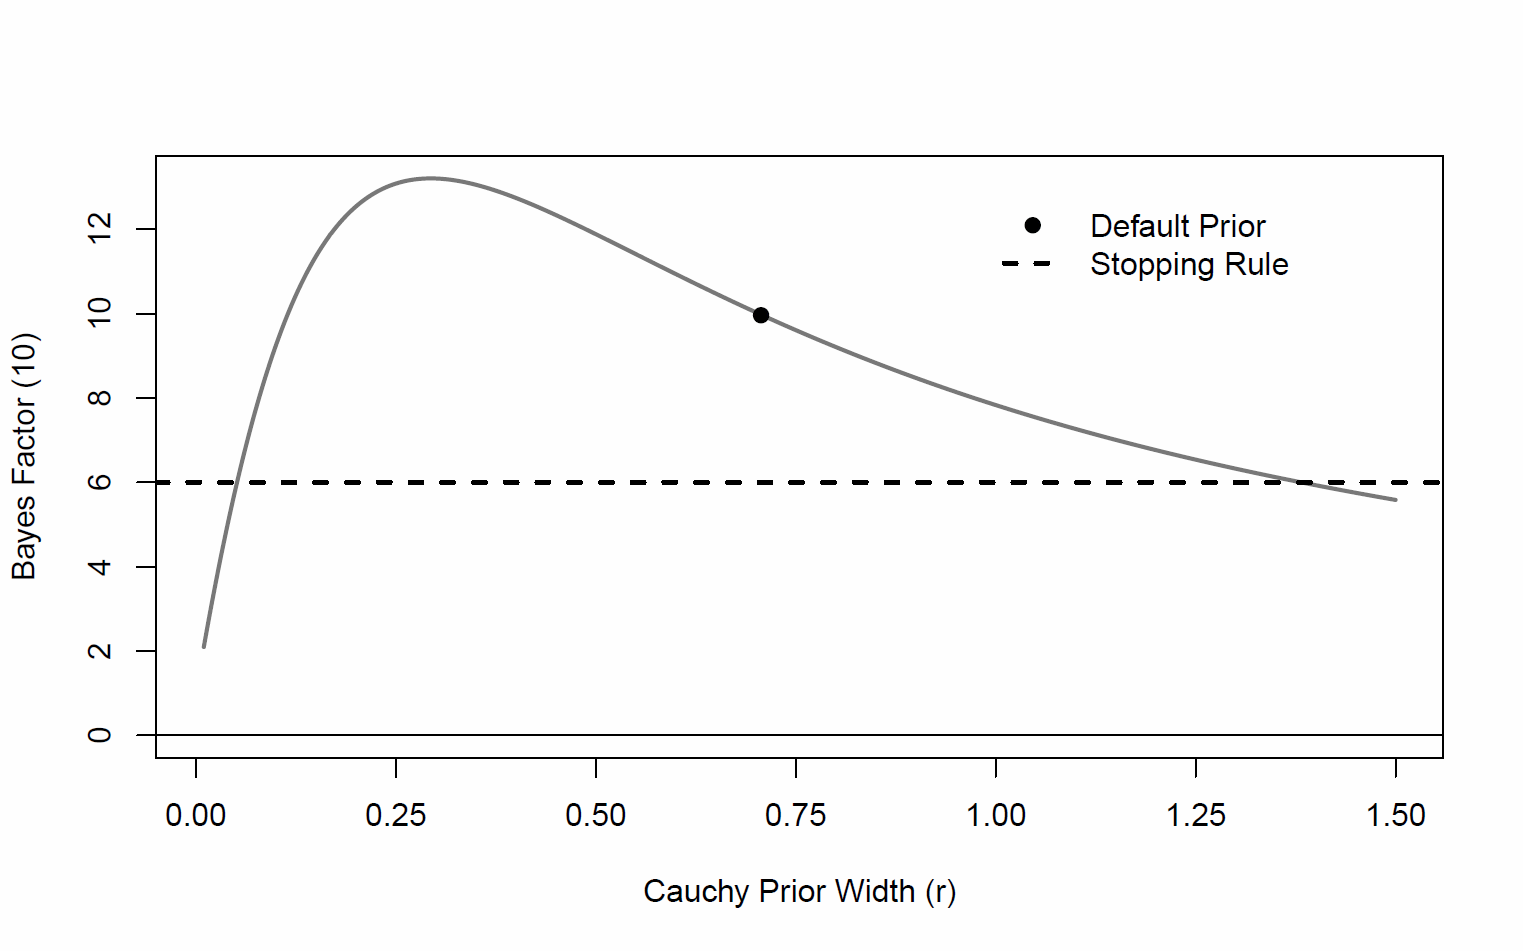
I am using the BayesFactor package to calculate Bayes factors of inclusion on some mixed-effect linear models. Jasp has the really cool functionality of plotting the prior robustness check like so:
Is there currently a nifty R function/package to do this, or close to this in R?
Comments
I am not sure but I'll ask Richard.
E.J.
Not by default, but it is easy in R. Here's some example code, using sapply.
# Data for the example:
set.seed(111)
x = rnorm(20)
y = rnorm(20) + .7
library(BayesFactor)
## With default
default_bf = as.vector(ttestBF(x,y))
## equal intervals on log scale from 1/3 to 3 times the default
r_values = exp(seq(log(1/3), log(3), len = 20)) * sqrt(2)/2
bfs = sapply(r_values, function(r) as.vector(ttestBF(x,y, rscale = r)))
plot(r_values, bfs, ty='l', log = 'xy', las = 1,
ylab = "Bayes factor", xlab = "Prior scale")
abline(v = sqrt(2)/2, lty=2)
# Add default
abline(h = default_bf, lty=2)
points(sqrt(2)/2, default_bf, pch = 19)
text(sqrt(2)/2, 10^(par()$usr[3]), "Default", srt = 90, adj = c(-.1,-.2))
text(10^(par()$usr[1]), default_bf, glue::glue("BF={round(default_bf,3)}"), adj = c(-.1,1.2))