

Very discrepant results from Repeated-Measures ANOVA and Bayesian R-M ANOVA

Hello!
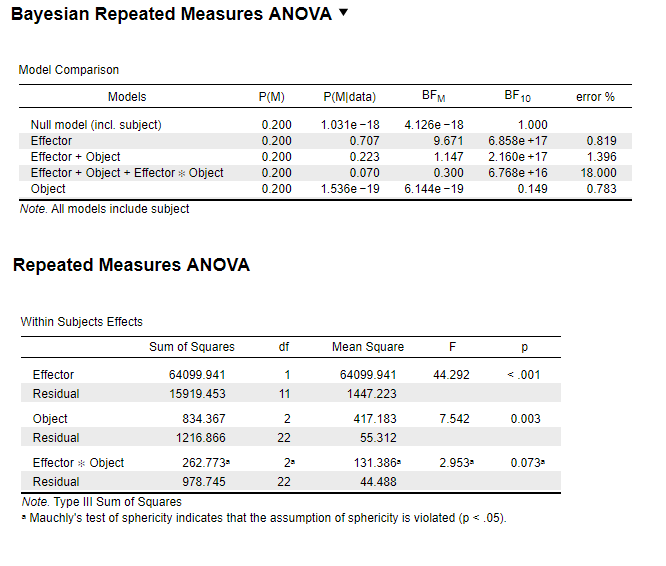
I'm running a 2*3 repeated ANOVA in JASP (0.10.2) using the frequentist and Bayesian method. However, for the main effect of one of the factors, the p-value from ANOVA is <.0.005 when the BF10 is less than 1. This happened to multiple dependent variables. I'm attaching screenshots of the results below:
- DV1: For the main effect of "Object", BF10=0.149 when p=.003
2. DV2: For the main effect of "object", BF10=0.376 when p<.001
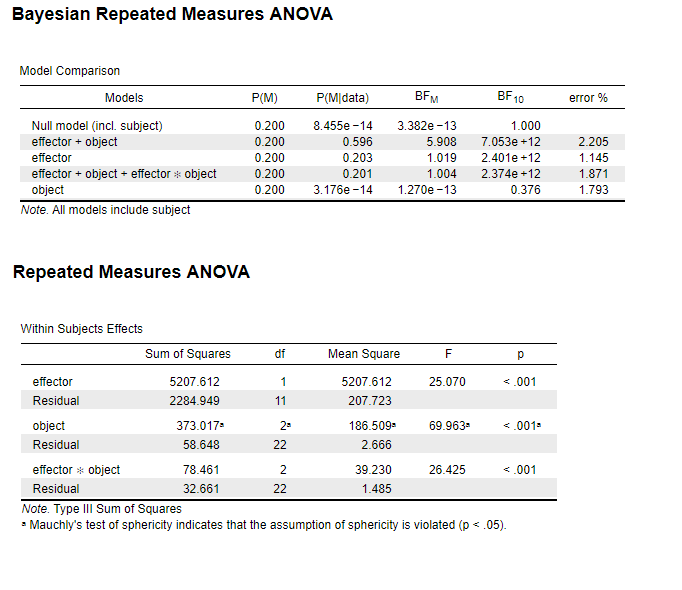
For DV2, if I collapse the factor "effector" and only insert "object" as a one-way Bayesian repeat-measures ANOVA, the BF10 is 1.8e+7, which makes more sense given the p values . Does anyone have any insights on why the R-M ANOVA and Bayesian R-M ANOVA output such different results?
Thank you,
Yuqi
Comments
Hi Yuqi,
We've come across these kinds of discrepancies before. Usually the Bayesian results are consistent with what you'd get from applying a frequentist linear mixed model to the data (the Bayesian RM ANOVA is really a mixed model). Also, the model comparison works a little different in the frequentist framework, where you test with comparison to the full model. I'm attending some other people from the team to this post, they may have more to say.
Cheers,
E.J.
Also, I recommend you update to 0.14.1 :-)
Hi E.J.
Thanks for your feedback. I ran the same analyses in 0.14.1 and got the same results. In cases of such large discrepancy, how should I interpret and report the results in papers? I appreciate if anyone from your team can help with this!
Also, can you explain more, or point to me any documents, about how model comparisons are done differently between the frequentist and the Bayesian framework?
Thanks,
Yuqi
Hi Yuqi,
The project that EJ referenced is available as a preprint here: https://psyarxiv.com/y65h8/
We are currently working on expanding this to a special issue, with a discussion on best practices in Bayesian mixed model comparison. We have noticed that results between JASP/BayesFactor and p-values occurs when here are strong random effects present in the data (so for instance, your participants responding very differently to manipulation of your "effector" variable). It is hard giving a clear answer without access to the full data set. So if you want to email it to me (j dot b dot vandoorn at uva dot nl), I can take a closer look and give a more extensive answer.
Cheers
Johnny
Hi Johnny,
Thank you! I will send the data to your email.
And I have a follow-up question. It's less a concern for t-tests because there are no mixed models involved, correct?
Thank you for your help,
Yuqi
Hi all,
I am currently facing the same issue, my bayesian results are completely different from my rm-ANOVA results where I analyse a 3 x 2 x 2 fully within-subject design. I am having a really difficult time deciding how to procede as these two different approach would lead me to conclude very different things.
Interestingly however, the bayesian results are very much in line with the results of a linear mixed model (using lme4) where I only add a random intercept for participants (y ~ a*b*c + (1|ID). However, I read that a LMM model without random slopes can lead to very high type 1 errors so these slopes should be fitted whenever possible (even for aggregated data; Brauer & Curtin, 2017). Since my data seems to include a lot of random variation, this makes me a bit suspicious of the bayesian anova results, as it seems that,this is similar to an intercept only model and might therefore not be reliable. For example, if I fit the following model to my (aggregated) data: y ~ a*b*c + (a*b | ID) + (b*c| ID) + (a*c| ID), the results are very much comparable to the frequentist rm anova results (here I only omitted a slope for the highest level interaction as this is not possible with aggregated data).
I am wondering what your thoughts on this are and what you how you would recommend to go about.
Thanks a lot in advance!!
Myrthe
Hi Myrthe
Cheers,
E.J.