

Discrepant results between non-parametric frequentist and Bayesian independent Samples t-test

Hi!
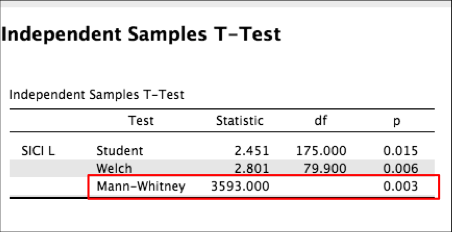
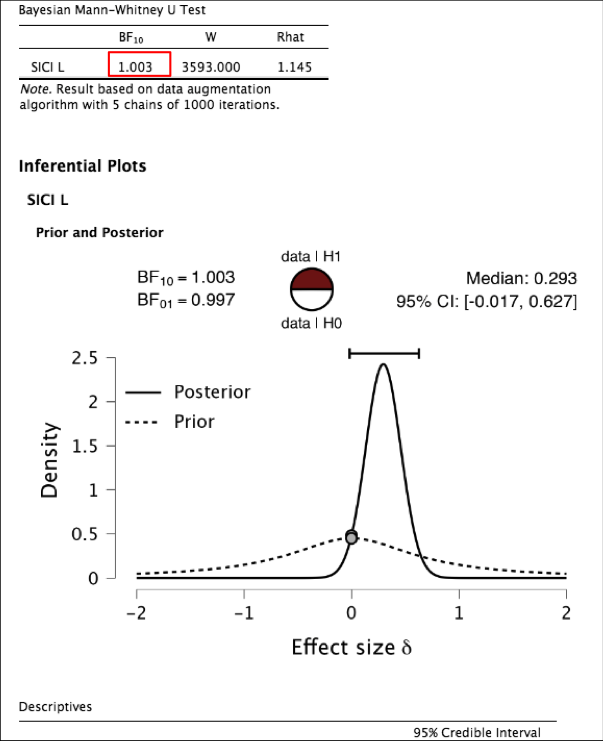
I ran the Mann-Whitney independent samples t-test using the frequentist and Bayesian approach. I obtained a p value of 0.003 whereas the Bayesian factor was just 1.003 (with Group 1 ≠ Group 2). What could explain this discrepancy between the results? I attached the tables. Thanks!
Comments
Hi Claudia,
That seems like a strange result indeed. What version of JASP are you using? If you are using the latest version (0.15), would you be able to share your data set or jaspfile with me, so I can take a closer look? you can send it to j.b.vandoorn (at) uva.nl.
Kind regards
Johnny
Hi @claudia ,
I took a look at the results, and I think this is a case where the Bayesian analysis is more conservative than the p-value. Whether to take this as a critique of the Bayes factor (for being too conservative), or a critique of the p-value (for being too permissive), is perhaps a personal decision. I would like to point out that the p-value is more sensitive to large sample sizes (and discrepancies between two sample sizes). This sensitivity is also known as Lindley's paradox.
When looking at the Bayesian t-test, there also does not seem to be evidence in favor of the alternative hypothesis (Bayes factor lower than 3), which further underscores the point above. I would have preferred there being something wrong with the analysis, or some setting, but unfortunately this seems to me like a case of not very conclusive data.
Kind regards,
Johnny
Hello, I'm also curious about this (seeing as the results are *very* different). Could I also check out the data or jasp file? My email is patrick.coulombe@d22consulting.com
By the way R-hat of 1.145 seems to indicate the chains have not converged (though I'm not sure that's what would explain the results)