How to plot my aggregated trajectories using mousetrap in R
Hi everyone :)
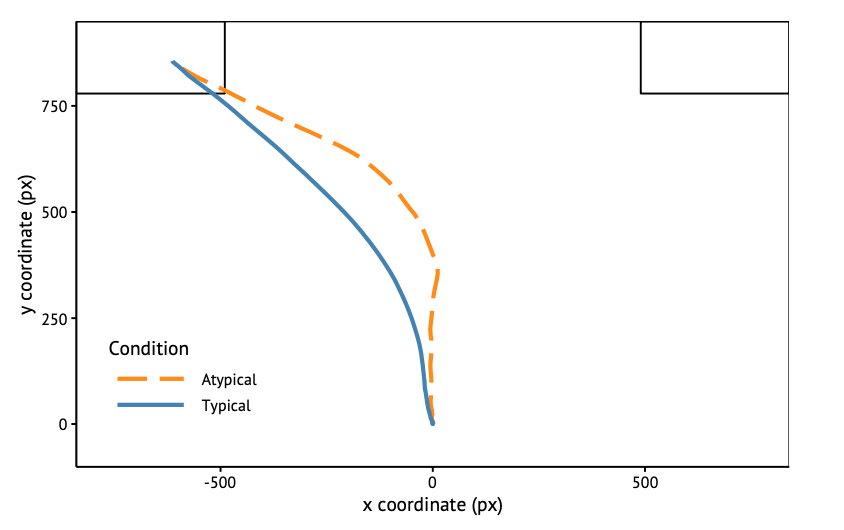
I am trying to plot the xpos and ypos from my tn_trajectories. I want the plot to look something like this, I want it to include the entire mouse tracking screen and both options illustrated with two small squares in each of the upper corners.
I preprocessed the data in the same way (time normalize, exclude initiation, align start and finish and symmetric remapping). This is how I remapped it to be symmetric:
raw_remapped <- mt_remap_symmetric(
 raw_remapped,
 use = "tn_trajectories",
 save_as = "tn_trajectories",
 dimensions = c("xpos", "ypos"),
 remap_xpos = "left",
 remap_ypos = "no")
But when I apply the mt_plot_aggregate function like this after preprocessing:
mt_plot_aggregate(raw_remapped, use="tn_trajectories", color="condition") +
ggtitle("Aggregated trajectories") + theme_minimal()
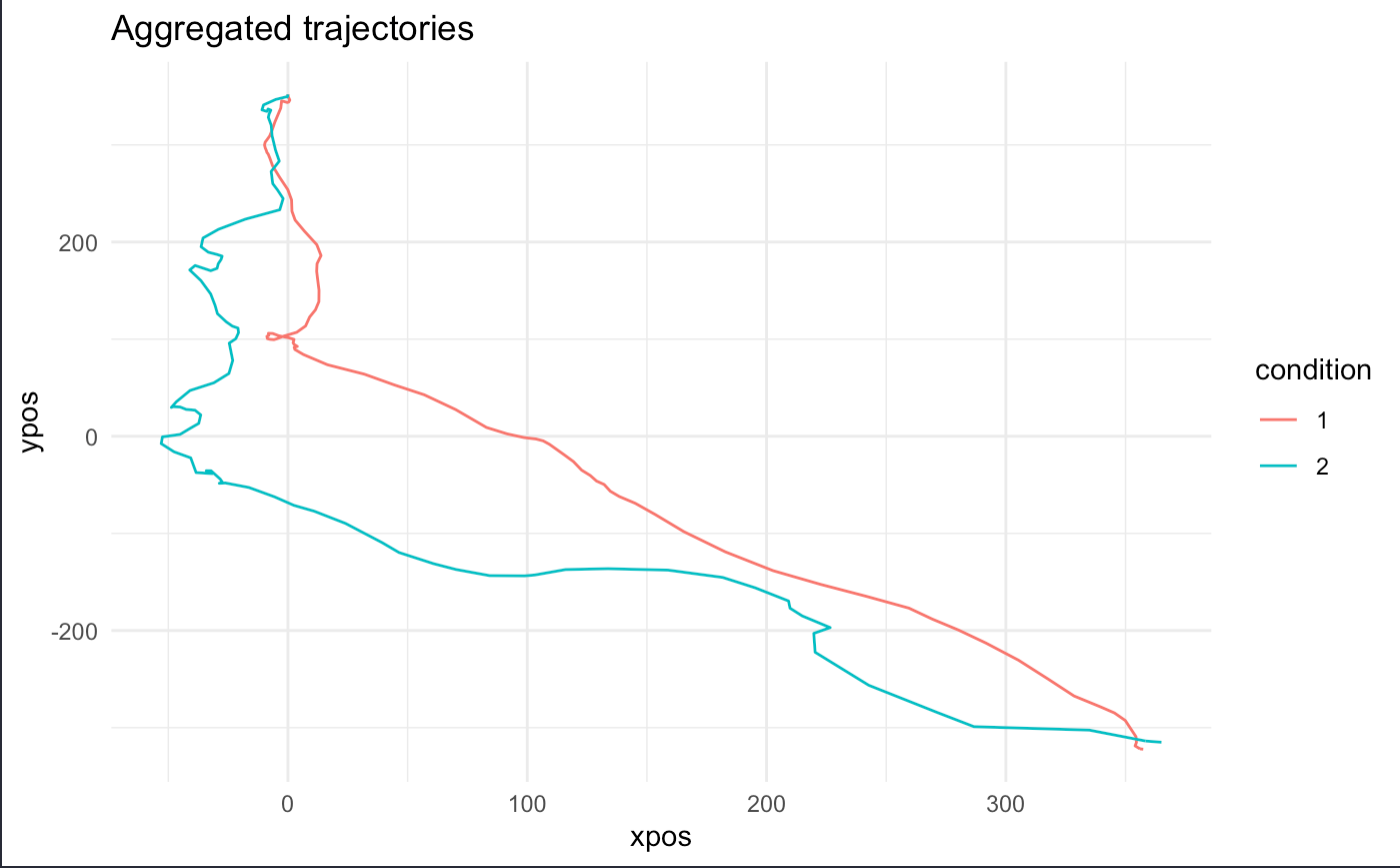
I get this plot:
I don't understand why the trajectories start at x=350, since the mouse was reset to x=0, y=-352 at each trial round and the starting point on the y-axis is correct. From the plot you get the impression that the option not chosen was very undesirable since the trajectory is nowhere near the upper right corner. This is not the case, since the blue line indicates a stronger leaning toward the option not chosen (no) compared to the option chosen (yes). I looks like both options are to the left of the starting point, which they are not.
Please ask questions if this is confusing! I hope you can clear it up for me.
Best wishes
Sara :)


Comments
Hi Sara,
could you share the complete code for preprocessing, i.e., including the part where you align the trajectories and the code you use for plotting? Also, you were writing "align start and finish" above in which case you would not have to do the subsequent remapping. If you only align at the start and not at the end, a remapping would make sense.
Another comment, just from a first visual impression of the plot: it looks to me as if your trajectories are upside down, i.e., they are aligned at the start (in the top left) and then travel towards the bottom right (and actually deviate towards the unchosen option which would then be in the bottom left). This is often the case if trajectories are not remapped as in many software packages (e.g., in OpenSesame) raw y values increase as the cursor moves down (and not as it moves up).
Best,
Pascal
Importing the data
Including only yes-responses
Time normalizing
Align start and end coordinates.
raw_remapped <- mt_align_start_end(raw_remapped,
          use = "tn_trajectories",
          save_as = "use",
          dimensions = c("xpos", "ypos"),
          start = c(0,0),
          end = c(-1,1),
          verbose = FALSE)
Remapping to left side of the screen,
raw_remapped <- mt_remap_symmetric(
 raw_remapped,
 use = "tn_trajectories",
 save_as = "tn_trajectories",
 dimensions = c("xpos", "ypos"),
 remap_xpos = "left",
 remap_ypos = "no"
)
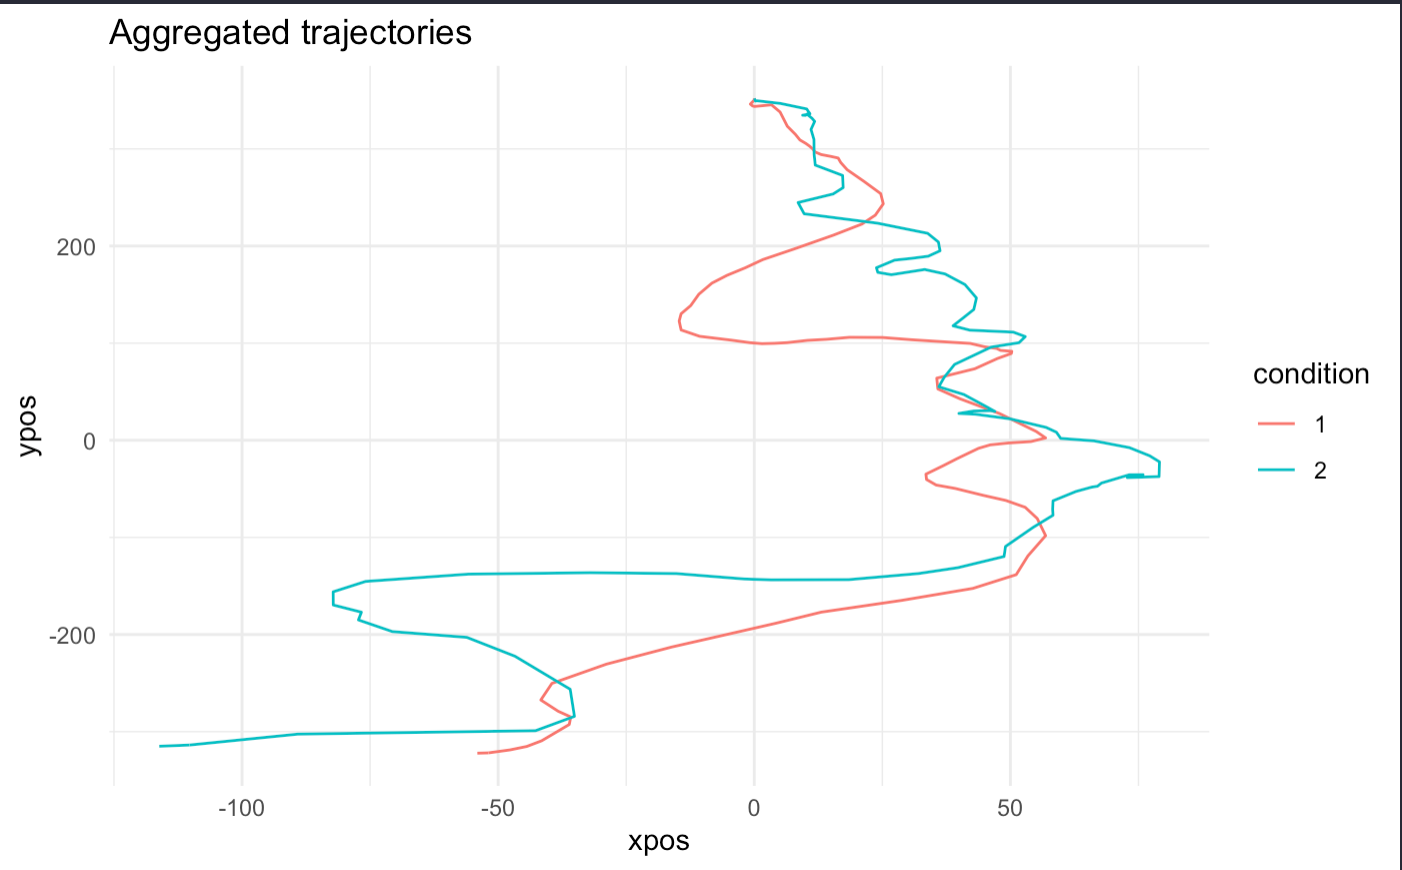
When I ran through it and left out the last step of remapping it looked like this:
I use this to plot
aggregated <- mt_plot_aggregate(raw_remapped, use="tn_trajectories",
 color="condition") + ggtitle("Aggregated trajectories") + theme_minimal()

If I use the non time normalized data in mt_plot_aggregate specified in "use=tracejtories" it looks like this
Ahh, I see how it's upside down. How do I fix that?
Sara
Hi Sara,
I think there are some minor issues with some of your code snippets above:
raw_remapped <- mt_align_start_end(raw_remapped,
          use = "tn_trajectories",
          save_as = "use",
          dimensions = c("xpos", "ypos"),
          start = c(0,0),
          end = c(-1,1),
          verbose = FALSE)
In the code above setting save_as to "use" with quotation marks does not work as it will then store the start-end-aligned trajectories actually in the "use" element. You could just leave this line out and then the start-end-aligned trajectories are stored in "tn_trajectories":
raw_remapped <- mt_align_start_end(raw_remapped,
          use = "tn_trajectories",
          dimensions = c("xpos", "ypos"),
          start = c(0,0),
          end = c(-1,1),
          verbose = FALSE)
I also don't think it makes sense to do both mt_align_start_end and mt_remap_symmetric (as the remapping will implicitly be done by mt_align_start_end). However, it could make sense to not use mt_align_start_end and instead use mt_align_start only and then mt_remap_symmetric afterwards and specify remap_ypos to "up", e.g., like this:
# Time normalize trajectories (as was done above)
raw_remapped <- mt_time_normalize(raw)

# Align start positions
raw_remapped <- mt_align_start(raw_remapped,
          use = "tn_trajectories",
          dimensions = c("xpos", "ypos"),
          start = c(0,0),
          verbose = FALSE)

# Remap trajectories
raw_remapped <- mt_remap_symmetric(
 raw_remapped,
 use = "tn_trajectories",
 dimensions = c("xpos", "ypos"),
 remap_xpos = "left",
 remap_ypos = "up"
)
Best,
Pascal