

Interpretation of Logistic Regression Output

Hi All --
I am working on an analysis to try and determine whether employee tenure (months at the company) has an influence on whether or not the employee has visited an office location in the past 3 weeks.
I have a dataset that includes a categorical variable "VisitedOffice" which indicates a 1 if the employee has visited the office and 0 if they have not. I chose to use a Logistic Regression as that seems to make the most sense for my categorical dependent variable.
For my independent variable, I have put in "EmplyeeTenure" which is a scale value that represents the number of months the employee has been at the company.
My output is as below:
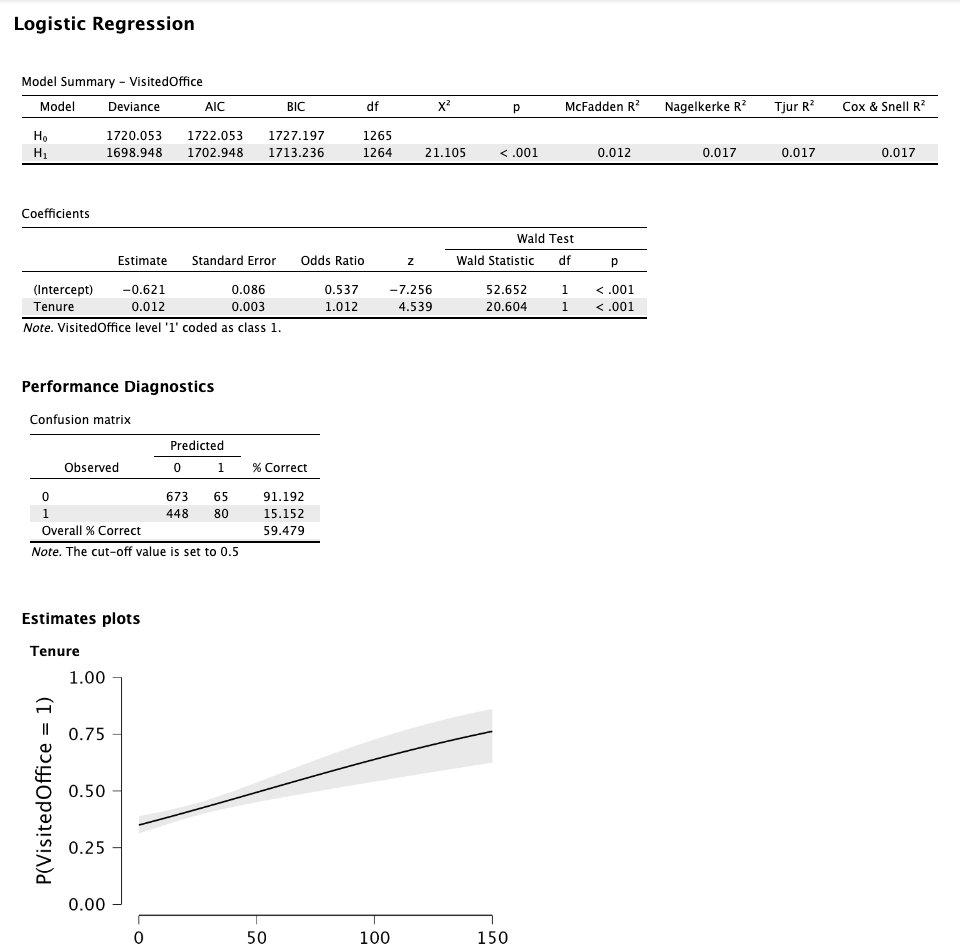
I recognize that this model isn't very predictive as the % correct is only 60% and the R-square is less than 2%.
Am I correct to interpret this as: A one month increase in tenure increases the likelihood of visiting an office by 1.2%. However, the model is not statistically significant, and indicates tenure does not appear to have an impact on whether or not an employee has visited an office.
Comments
Hmm I'll pass this on to our expert, but I think the results show that "Tenure" is in fact highly significant (as is also evident from the plot). If the odds ratio is indeed for a single unit (i.e., month) this does tend to cause a large effect across multiple months. The confusion matrix seems to support this interpretation.
E.J.
As E.J. points out, "Tenure" is highly significant. Since you have only one predictor in the model, you can also see this in the model summary table where the model that includes "Tenure" outperforms the null model.
The pseudo R-squared measures do indicate that the relationship is not particularly strong (or rather, despite that "Tenure" does predict "VisitedOffice", it does not predict it perfectly). But as E.J. said, the parameter estimates depend on the scale of the measurement. If you predictor is in the scale of months, then odds ratio of 1.012 means that the odds of visiting the office increase by a factor of 1.012 (on average) for every month of tenure, which, as is shown in the plot, can have big cumulative effects over longer periods of time.