

Bayesian repeated measures ANOVA - Model Comparison vs. Analysis of effects

Hi,
I posted this question a few weeks ago (see the thread below) but apparently went unnoticed. So I just re-post it just in case I get luckier this time.
Anyway, I'm quite new to Bayesian Anova so I'm a having a bit of a difficult time interpreting the JASP output. I've run a 2 (Task) x 2 (Load) x 2 (Laterality) model for which I get the following output:
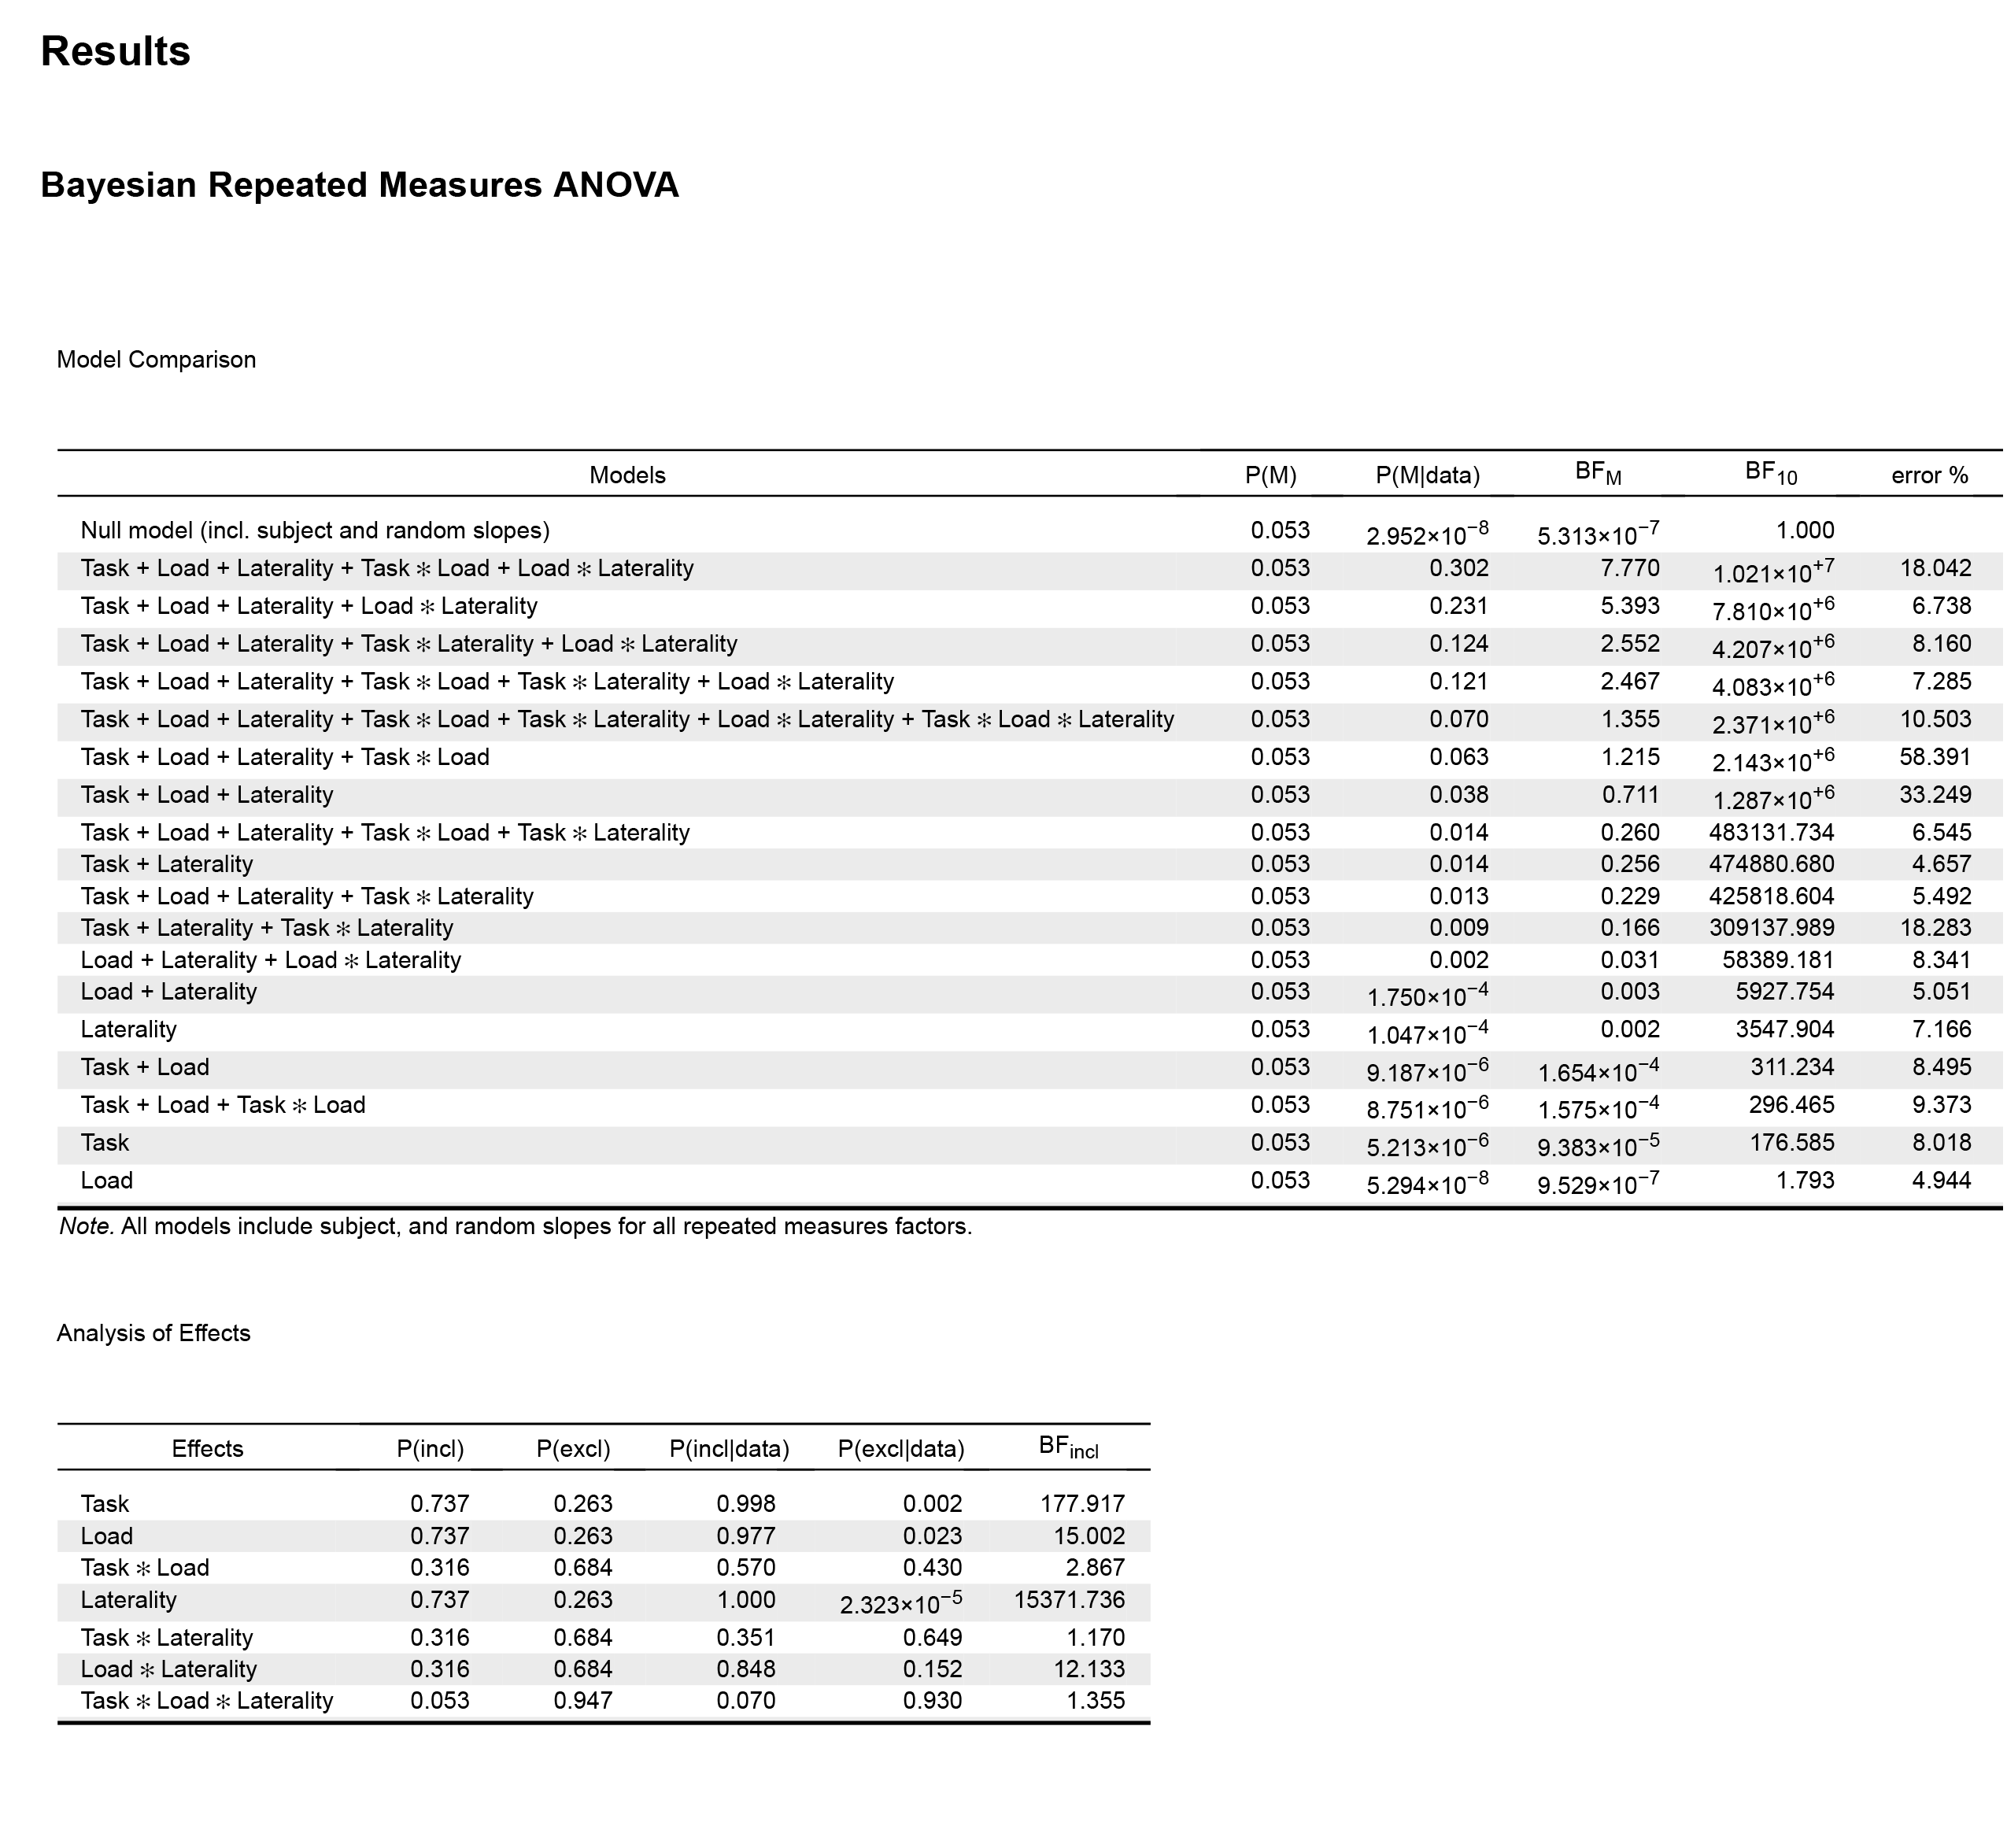
In the results output above, the "Model Comparison" table suggests that Task + Load + Laterality + Task ✻ Load + Load ✻ Laterality is the best model, followed by Task + Load + Laterality + Load ✻ Laterality. However if I do the math (10210000/7810000), it seems that the data is just 1.3 more likely under the first model.
In the "frequentist" ANOVA, the three main effects are significant together with Load ✻ Laterality interaction (no further significant interactions). So, the second model in the Bayesian ANOVA would be in line with the results from the frequentist ANOVA, but not the first one.
Then JASP shows the "Analysis of effects" table. Here the goal is to retain model selection uncertainty by averaging the conclusions from each candidate model, weighted by that model’s posterior plausibility (according to Wagenmakers et al., 2018, Bayesian inference for psychology. Part II). If I look to the BF inclusion values in this table, the results are also in line with the frequentist ANOVA, showing strong evidence in favour of the three main effects and the Load ✻ Laterality interaction. Note that this values are computed "across all models", however the BF values are lower if I compute "across matched models".
In sum, my question refers to how to best interpret these results. Should I look to the "Analysis of effects" table or to the "Model Comparison" output? It would seem that the results are different whether I look to one or the other.
Any help would be very much appreciated.
Thanks.
Comments
Hi MikJ,
Thanks for sticking around, and sorry I missed this. Will bring it to the attention of the group. Some quick comments:
Cheers,
E.J.
Hi E.J.,
Thanks a lot for your reply. I have now put the "best model on top" (see below) and have computed the "Analysis of effects" across matched models". Here the output:
The BF inclusion value for Task x Load is 1.23 now, so it seems that whether I compute "across all models" or "across matched models" is of importance to interpret the results, is it?
Regarding your second point, I'm not sure how I might be able to do that. Regarding your third point, I had read that post and I'm therefore running the analyses on the latest JASP version. Regarding you fourth point, I attach the results of the frequentist ANOVA in case it might help.
In sum, my main doubt is whether Task x Load interaction is supported by the data and should be reported this way, that would critically change the interpretation of my results.
Thanks again,
M
Hi MikJ,
I don't have much to add, but maybe some additional comments help to better understand what you are seeing. I agree with EJ that the two tables paint a fairly consistent picture. I assume that you are worried that when you compare the two best performing models, which differ only with respect to the `Task * Load`-interaction, the result is ambiguous; the inclusion Bayes factor for that interaction, however, is almost 3. The first seems more in line with the non-significant p-value from your frequentist analysis.
Note that none of these Bayes factors directly corresponds to the model comparison that underlies your frequentist F-test. If you have been using the default settings, the frequentist F-test is a top-down comparison between the full model, including all terms, and a model omitting the tested term. The model comparison you are looking at (contrasting the best two models), has no equivalent in the frequentist results you are looking at. To obtain corresponding Bayes factors, you need to
See our preprint (pp. 7-8) for a worked example. In you case, for a frequentist ANOVA with Type-II-SS (not the default; your table does not include the models to do the calculations that correspond to Type-III-SS), you need to compare the models in lines 5 and 4 in your table. This yields BF10 = 4.083e6/4.207e6 = 0.9705253, or BF01 = 4.207e6/4.083e6 = 1.03037---no evidence either way.
Model averaging gives a slightly different Bayes factor because you are taking model uncertainty into account, rather than focusing on two models. The intuition here is that almost all models including the `Task * Load`-interaction perform well and are barely distiguishable, but many models without the interaction don't do well. This, of course, depends on which part of the model space is considered here. What is the inclusion Bayes factor for the interaction when you average across matched models?
Best,
Frederik
Sorry, I only just saw your reply, which gives both the frequentist and the matched model result (which, IMHO is preferable to averaging across all models). It's all pretty consistent: The data provide almost no evidence regarding the Task x Load interaction.
Hi Frederik,
Thank you very much for the clarifications and the link to the preprint. I assume then that, for increasing number of factors (as in this case):
Overall for this data, both the Bayesian and frequentist ANOVA are consistent in their results.
Thanks a lot to you and E.J. for your help.
Best,
M
Hi Frederik & E.J.,
One last question. Regarding the Cauchy prior distribution, I'm not sure whether the default setting for the RMAnova is specified as a multivariate Cauchy distribution with r = 1/2. Is this correct? I've seen that a paired t-test use a Cauchy prior centered on zero (scale = 0.707).
Thanks,
Mikel
That should be mentioned in the documentation. And you should be able to change this in the GUI...anyway, a check is to use a one-factor RM ANOVA with two levels and see whether you get the same result.
E.J.
Hi Mikel,
the scaling parameter r is different between t-test and ANOVA because the underlying model parameterization is different. This had me confused at one point, too. See this thread for details.
Best,
Frederik
Hi E.J. and Frederik,
Thanks for your replies. The default priors are fine with me, I'd only need this info to report it together with the ANOVA results.
Following the thread in the link, I'd assume the scale for the ANOVA is (-sqrt(2)/2, sqrt(2)/2), I will try to double-check in the JASP documentation.
Thanks a lot,
Mikel