

Comparing two proportions within contingency table for small sample size

I need some help for statistical analysis.
I have the following contingency table :
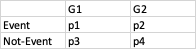
I want to compare p3 and p2, that is comparing the proportion of event in G2 and the proportion of not-event in G1. How is it possible? I have a small sample size: p1 = 3, p2 = 4, p3 = 8 and p4 = 2.
Thanks for your help
PM
Comments
R
Thanks for your answer @andersony3k
Your output shows the result for the comparison between four proportions. However, I would like just compare G2-E and G1-NotE in your output. It is possible?
Hi.
It compares two proportions, not four. A two-by-two contingency test is interpretable as a test of the difference between two proportions: The observed values will differ from the expected values only to the extent that the two proportions are different.
R
Hi @andersony3k
So in your output p-value compares G2-E and G1-NotE? Is there not influence of G1-E and G2-NotE?
A 2 X 2 contingency-table analysis compares observed cell counts to the cell counts one would expect if there were no relationship between between Variable 1 (G_cond) and Variable 2 (E_cond). A significant p value for a Chi Square test would mean that the set of observed cell frequencies are significantly different from the set of expected cell frequencies. (It would not be a comparison the G2;E frequency to the G1;NotE frequency.) See
Here, I've elected to output the result of Fisher's exact test rather than Chi Square because some of the expected frequencies are less than 5.
See the references, below.
R
Thank you @andersony3k. However, my question was if is it possible to target a comparison between two proportions within the contingency table? For example can I conduct a statistical test that compares p2 and p3?
Hi,
If you mean p1, p2, p3, and p4 to be simply 3/17, 4/17, 8/17, and 2/17, respectively, then the testing of p2 vs p3 involves first leaving them as frequencies (f) rather than dividing each by 17. Thus, f1, f2, f3, and f4 equal 3, 4, 8, and 2, respectively. Then, you want to use a test like a Chi Square goodness-of-fit test (JASP calls it a "multinomial" test) or binomial test to assess whether f2 (i.e., "4") is significantly different from f3 (i.e., "8"). This is, by the way, conceptually identical to testing whether the proportion 4/(4+8) is significantly different from 0.5. (Note that f1 and f4 are mathematically irrelevant to the statistical question.)
See the example below.
R
Hi @andersony3k
Thank you for your answer. I’m going to describe the experiment.
In the experiment, Experimenter gives an object A or B to the participants. Next, he asks participants if they want to trade their objects with the alternative object (object B for participants receiving object A, and object A for participants receiving object B). I would like to compare the proportion receiving A that refuse to trade (p3) with the proportion of receiving B that accept to trade (p2).
Thus G1 and G2 are independent (corresponding to give object A and give object B). Thus proportion p2 is not divided by 17 (entire sample size). Rather p2 is n G2-Event/n G2 (I.e., 4/6) Likewise, p3 is nG1-notEvent/nG1 (I.e., 8/11).
I Hope it is clearer .
Hi. Based on this clearer information, I think the analysis should be the same as what I suggested initially but the data should be coded different. The test is obtained via FREQUENCIES, CONTINGENCY TABLES. Had the expected frequencies all been at least 5, a Chi Square test would have been appropriate, but because some expected were less that 5, Fisher's exact test is appropriate. The test assesses whether there's a significant contingency between the identity of the initially gotten object and the ultimately selected object. This is mathematically equivalent to the question of whether the poportion, InitA_UltA / (InitA_UltA + InitA_UltB) is significantly different for the proportion, InitB_UltA / (InitB_UltA + InitB_UltB).
As you can see below, the p value is non-significant.
R
@andersony3k thanks for your helps.
With this option, can I have information about the comparison between A-refusing versus B-accepting ?
Each of those would be "the other side of a coin." Thus, the results, above, also describe "the comparison between A-refusing versus B-accepting." (You can rearrange the data to convince yourself that that's true.)
R