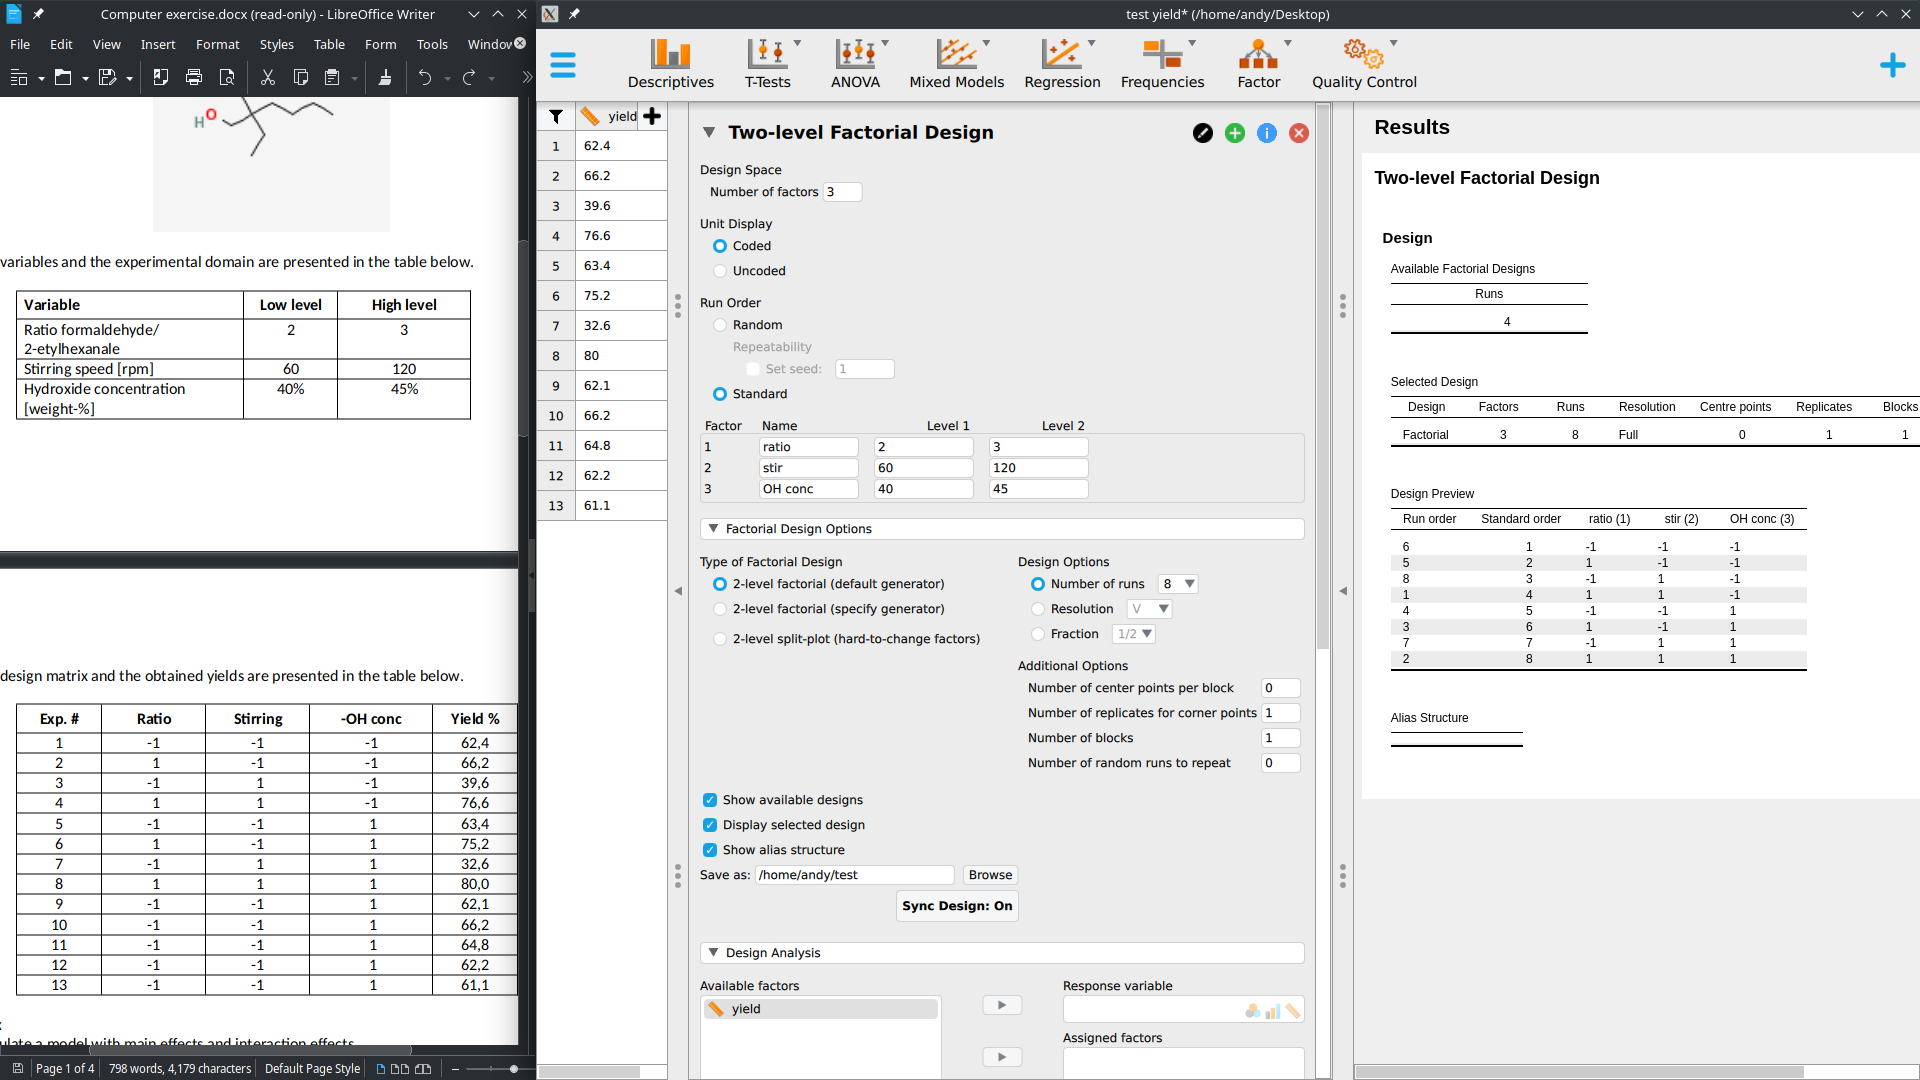
How to use JASP for two-level factorial design in quality control module?
Hi,
I have three factors for chemical reaction which will give the result as yields.
Exp 9-13 are repetition of Exp 5.
I would like to find the main factors and confounding factors.
I would setup my generator as A B C AB AC BC ABC
The reason for experiment repetition is to find the confidence interval with 0.975 confidence of 4 degree of freedom.
I did this exercise in python and predict the yield when ratio,stir,OH conc is 2.6, 80, 44 respectively.
I want to know if I can do with JASP, I could not figure out how to use this module.
Thanks
from pyDOE2 import fracfact
import numpy as np
import matplotlib.pyplot as plt
import statistics
from scipy import stats
gen = 'aa a b c ab ac bc abc'
x = fracfact(gen)
ratio = [2,3]
stir = [60, 120]
conc = [40,45]
Y = [62.4, 66.2, 39.6, 76.6, 63.4, 75.2, 32.6, 80.0]
rep = [62.1, 66.2, 64.8, 62.2, 61.1]
b = 1/len(Y) * x.T @ Y
vb = 1/len(Y)*statistics.variance(rep)
sb = vb**0.5
t_stat = stats.t.ppf(0.975, 4)
conf = t_stat*sb
gen_lab = (gen.split())[1:len(Y)]
B_new = b[1:len(Y)]
plt.bar(gen_lab,B_new)
plt.axhline(y=conf,color="red")
plt.axhline(y=-conf,color="red")
plt.axhline(y=0,color="blue")
plt.show()
x1 = np.interp(2.6,[2,3],[-1,1])
x2 = np.interp(80,[60,120],[-1,1])
x3 = np.interp(44,[40,45],[-1,1])
yield_result = b[0] + b[1]*x1 + b[2]*x2 + 0*b[3]*x3 + b[4]*x1*x2 + b[5]*x1*x3 + 0*b[6]*x2*x3 + 0*b[7]*x1*x2*x3
print(yield_result)


Comments
Hi Andy,
To analyze this kind of data you need to set up the dataset in a different way. You can use the DOE module to create a design with possible combinations of the factor levels. You can then use JASP to save this design and create a dataset with an empty response variable to fill in.
In your case, however, you already have a design that you want to analyze. This is also possible with the DOE module, but your dataset should have the structure as in the table you shared. Under "Design analysis" you can then drag the variables to the right field. The result should look like this:
Is this what you wanted to do? Let me know, I would also be very curious to hear whether the results you got in Python match the results in JASP!
Best,
Jonas
Hi @JTPetter
I am a great JASP's fan and I just discover the Quality control module.
I use the version 0.17.1 and I found how to create a design but not how to analyse the results when they have been filled. Where is hidding the marvelous "Design Analysis" function ?
Thanks a lot !
Angers (Angers is the name of my city in France : i am not angry at all ;) )
@Andy . I don't know what "confounding factors" and "generator" mean in this context. If this is referring to an analysis of variance, things should be set up as follows, with the goal being to assess main effects and interactions.
R
Hello !
Thanks a lot ! Sadly, in a quality control process, we have n=1 in each group, therefore we cannot run a classical ANOVA with JASP.
The question remains...
thanks
Hi @Angers ,
there was a "analyze design" tab under the factorial design in versions previous to 0.17.0. This might have been able to handle your design, but it was not fully developed, so we removed it as we continued working on this. We are now done reworking the analysis functionality and it will be included in the upcoming 0.17.2 version. This version will have a separate section for "Analyze Design" in the QC module.
The 0.17.2 version should be released very soon, keep an eye on the website! If you're very eager to try out the new features, you can also find upcoming features in the nightly versions here: https://static.jasp-stats.org/Nightlies/. But keep in mind that these are not official releases, as explained on top of the website.
Best,
Jonas
Thanks Jonas @JTPetter !
I am glad to learn this very good news and I look forward to discovering the new features.
I am usign JASP with my students since 5 or 6 years and I am very grateful for the fantastic job you achieve : that's awesome, thanks a lot to all the JASP team !