

Combine several plots into one

Hello folks! I have a question regarding combining data from several plots into one. I have the following structure of my data:
UserNumber Group Trial1TotalTime Trial2Total time ... Trial12TotalTime
1 Thermal 43 ....
2 Visual 23 ....
... ... ... ....
30 Thermal 33 ....
After inserting Trial times into the variables slot and Group into a split, I got something like this for each of the trials.
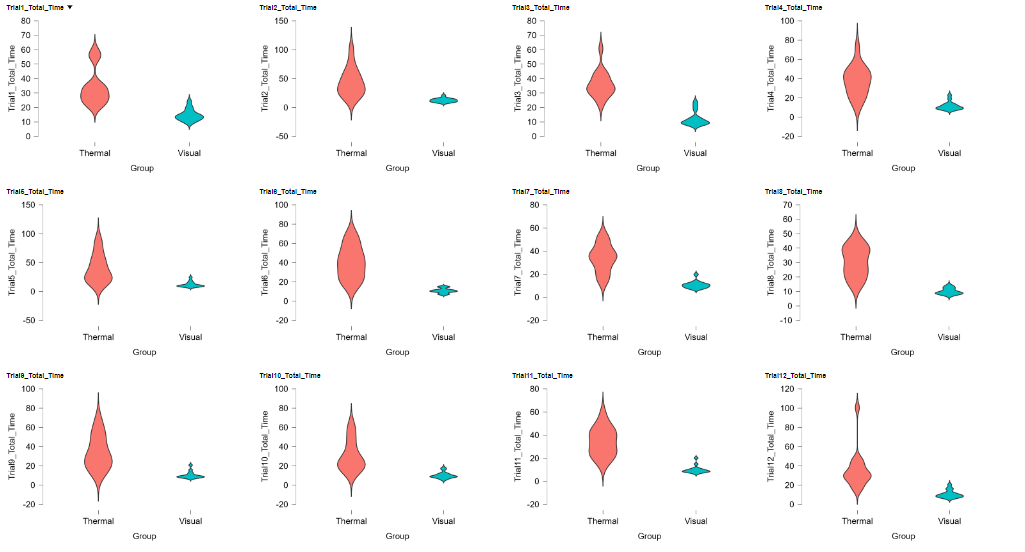
The only problem is that I want a single graph with that information. So on the x-axis, I will have a trial sequence like 1, 2, 3, ..., 12, while on the y-axis - Time (s). So for each trial, I will information about Visual and Thermal Groups. I watched different tutorials on YouTube but didn't find anything regarding how to combine these data. How to do it in JASP?
Comments
Did you check out the plots offered under ANOVA?
EJ