

Exploratory factor analysis in JASP

Hi,
I am quite new to factor analysis.
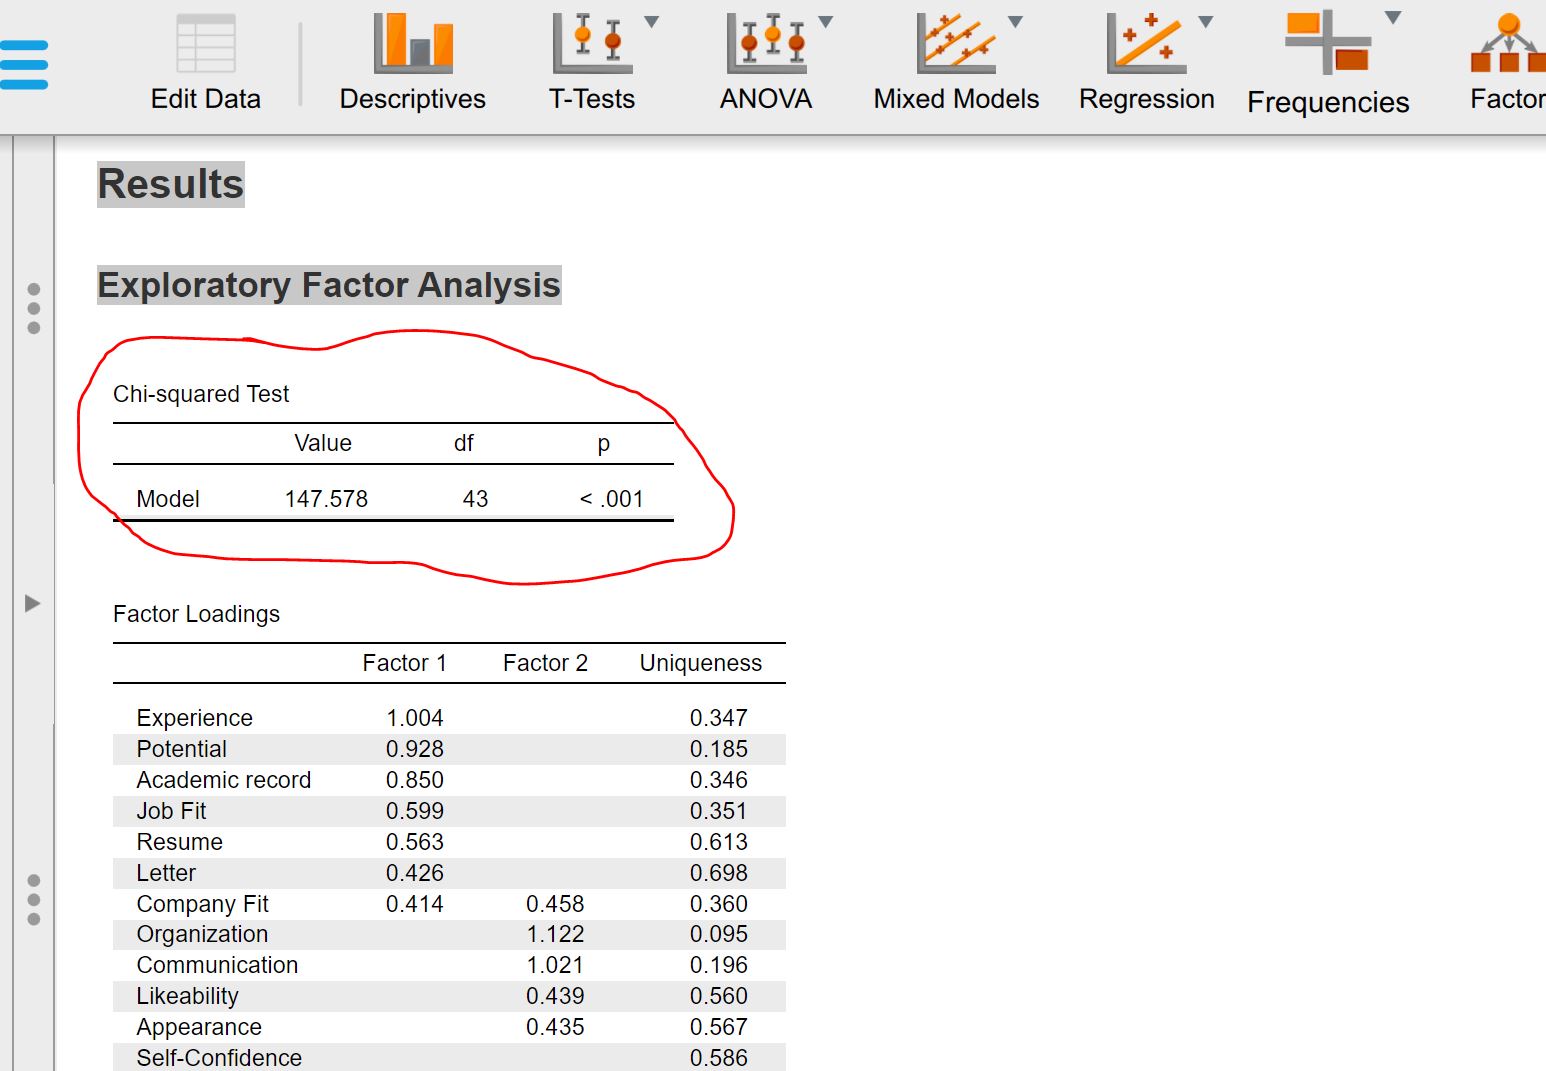
Could someone help me to understand the Chi square table that is generated when running EFA in JASP (see screen shot below).
What does is test and how should it be interpreted? What is "good" and what is "not so good"? I have not seen this in SPSS when doing a factor analysis. I don´t think the information provided using the "I" in JASP is very helpful.
Kind regards
Per
Comments
Hi Per,
I can't quite remember, but I think that SPSS can run this test?
in the JASP help documentation I find:
Chi-squared Test: The fit of the model is tested. When the test is significant, the model is rejected. Bear in mind that a chi-squared approximation may be unreliable for small sample sizes, and the chi-squared test may too readily reject the model with very large sample sizes.
Simply put, this means a significant test shows a poor fit between the model and the data. I would recommend you look at additional fit indices that JASP can also provide i.e. TLI etc.
Best,
Tarandeep
@TarandeepKang Thank you🙏🏻. That was very helpful. Do you have any other reading tips on the topic?
Per😎
Hi Per,
These two are good general ones from the help file
Osborne, J. W., Costello, A. B., & Kellow, J. T. (2008). Best practices in exploratory factor analysis. In J. Osborne (Ed.), ), Best practices in quantitative methods (pp. 86-99). SAGE Publications, Inc. https://doi.org/10.4135/9781412995627.d8
Yong, A. G., & Pearce, S. (2013) A Beginner’s Guide to Factor Analysis: Focusing on Exploratory Factor Analysis, Tutorials in Quantitative Methods for Psychology, 9(2), 79-94. doi: 10.20982/tqmp.09.2.p079
and this is also a good recent review:
Goretzko, D., Pham, T.T.H. & Bühner, M. Exploratory factor analysis: Current use, methodological developments and recommendations for good practice. Curr Psychol 40, 3510–3521 (2021). https://doi.org/10.1007/s12144-019-00300-2
Best,
Tarandeep-
@TarandeepKang
Hi,
Could you help me to understand the difference how to interpret the p-value in the Chi square table vs in the Bartlett test table when running an EFA in JASP?
Kind regards
Per
When conducting an Exploratory Factor Analysis (EFA) in JASP, both the Chi-square test and the Bartlett's test of sphericity are crucial in evaluating the data's suitability for factor analysis. However, their interpretations differ due to the distinct hypotheses they test. Here's a detailed explanation of how to interpret the p-values in each context:
Chi-Square Test in EFA
Purpose:
The Chi-square test in EFA is used to evaluate the model fit, particularly when assessing how well the factor model reproduces the observed correlation matrix.
Null Hypothesis:
The null hypothesis (H₀) states that the factor model fits the data perfectly, meaning there is no significant difference between the observed and reproduced correlation matrices.
Interpretation of p-value:
A high p-value (typically > 0.05) suggests that there is no significant difference between the observed and reproduced matrices, implying a good fit of the factor model to the data.
A low p-value (typically < 0.05) indicates that there is a significant difference between the observed and reproduced matrices, suggesting a poor fit of the model.
Usage in Decision Making:
If the p-value is low, it may indicate that the model needs to be adjusted, perhaps by increasing the number of factors or modifying the model structure.
However, it's important to consider the sample size, as large samples can make the Chi-square test overly sensitive, often resulting in low p-values even when the model fit is acceptable.
Bartlett's Test of Sphericity
Purpose:
Bartlett's test of sphericity assesses whether the correlation matrix is significantly different from an identity matrix, which would indicate that the variables are unrelated and unsuitable for factor analysis.
Null Hypothesis:
The null hypothesis (H₀) for Bartlett's test states that the correlation matrix is an identity matrix, meaning there are no correlations between the variables.
Interpretation of p-value:
A low p-value (typically < 0.05) indicates that the correlation matrix is not an identity matrix, suggesting that there are significant correlations among variables, making the data suitable for factor analysis.
A high p-value (typically > 0.05) suggests that the correlation matrix is close to an identity matrix, indicating insufficient correlations among variables for factor analysis to be appropriate.
Usage in Decision Making:
A significant p-value (low) supports proceeding with factor analysis, as it confirms the presence of sufficient correlations among the variables.
If the p-value is not significant (high), it may be necessary to reconsider the dataset or the variables included in the analysis.
Summary
Chi-Square Test:
High p-value: Good model fit.
Low p-value: Poor model fit (potentially adjust the model).
Bartlett's Test of Sphericity:
Low p-value: Data is suitable for factor analysis (sufficient correlations).
High p-value: Data is not suitable for factor analysis (insufficient correlations).
✅
Thank you very much @TFGs2022 for very clear and coherent explanation.🙏🏻
Per😎
Halo! Untuk membantu Anda, saya pikir diperlukan permintaan yang lebih tepat. Jika tidak, orang-orang hanya akan mengarahkan Anda ke literatur tentang analisis faktor. Anda juga dapat memeriksa manual JASP (di situs JASP) dan contoh kumpulan data di Perpustakaan Data JASP. Selain itu, alangkah baiknya jika Anda dapat menggunakan Google Translate untuk mengirim pesan Anda dalam bahasa Inggris :-)
Cheers,
E.J.