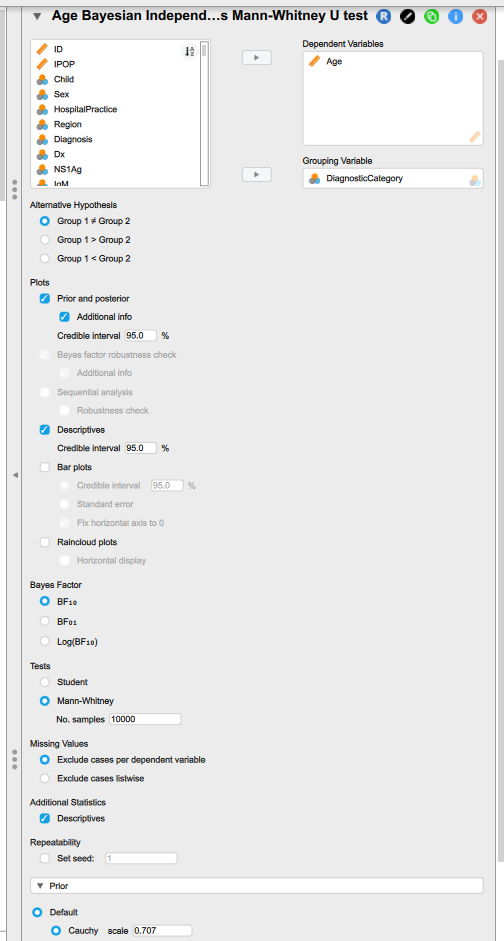
Bayesian Mann-Whitney U Test Showing Means of Groups in Table and Median Difference in Plots
As a Pediatrician, I am learning Bayesian analysis.
I analyzed the difference between two groups: Dengue fever children and Malaria Children.
I wanted to know whether there is a difference, in Age in months and Stay Duration in days (in Hospital), between the two groups of children.
As both Age and Stay Duration are non-normal even after trying log transformation, I tested the group differences using Bayesian Mann-Whitney U test for two independent samples.
In the results, I am not getting median values in the descriptives table. The tables show Means.
Is it appropriate to report mean values for such non-normal data using Mann-Whitney U test for (Bayesian) analysis?
The prior and posterior plots' results show median difference between the two groups.
What is the reason for the discrepancy in the two result outputs?
I share the inputs screen image and document showing output of results.
Thanks for the guidance and learning opportunity being provided.


Comments
I believe that the Mann-Whitney U test tells us, given a randomly sampled Value A (from Population A), and a randomly sampled Value B (from Population B), what's the probability that Value A is greater than Value B. So it's neither about means nor medians.
https://pmc.ncbi.nlm.nih.gov/articles/PMC1120984/
This 'probability of superiority' isn't usually included in the generated output, but the 'rank biserial correlation' effect size is -- and apparently, one can compute the probability of superiority from the rank biserial correlation:
https://en.wikipedia.org/wiki/Probability_of_superiority
R
Thank you for the educative input.
So, can one report mean and standard deviation of the two groups instead of medians and IQR of the two groups, with the results of Mann-Whitney U test, in a paper for a publication?
I think you can report any or all of those descriptive statistics, despite their disconnect from the Mann-Whitney U. Some people may not like it, though, because they think the Mann-Whitney U is about medians. Whatever you do, you should include an effect size for the Mann-Whitney U result (the rank biserial correlation and/or the probability of superiority).
R
Thank you for the clarification.
No problem. Also, I find the following example to be a helpful illustration that the Mann-Whitney U test isn't a test of difference between medians. The two groups have the same median (100), but the Mann-Whitney U test shows that the ranks (of all of the values together) tend to be significantly higher for one group than for the other. (My understanding is that the test functions as a test of medians only of the two groups happen to have identical pre-rank distributional shapes.)
R
Thank you for demonstrating the concept of Mann-Whitney U test by an example.
Using JASP can one know the distribution patterns of the two groups and get the relevant inferences?
Will JASP facilitate the right way of identification of the distributions of data and select appropriate statistical test for a researcher without statistical background?
This is currently a task that the researcher must do. The general rule is that when these tests give you very different outcomes, (a) you are in trouble; (b) you are probably better off with the Mann-Whitney
EJ
Thank you.
drravikch,
You can use the JASP Distribution module to check the fit of a given variable to all kinds of distributions. However, the utility of this may depend heavily on your familiarity with the topic of distributions. In any regard, unless JASP suddenly starts integrating the Gamlss package for distribution fitting (which would bring tears to my eyes), it is a process you will have to do manually.
If you are deeply concerned about distribution and it's impact on your analysis, however, and you aren't familiar enough with statistics to dive into something like Generalized Linear Modeling, then may I recommend bootstrapping your Independent Samples T-Test's Confidence Intervals as a nice place to start?
Dmartin427: maybe a good feature request?
EJ
Thanks for the new points.
For a researcher like a Clinician doctor with the following limitations:
Thank you all for trying to guide a novice to Bayesian path.
The best way of course is to attend our annual workshop in Amsterdam :-) Otherwise, working through some of our papers and course books also helps. (e.g., https://jasp-stats.org/jasp-materials/#papersJASP and https://www.bayesianspectacles.org/free-course-book/)
EJ
Thank you very much EJ for patiently nudging a non-statistician to Bayesian analysis learning path.
As a retired pensioner with certain limitations, I am not in a position to attend the annual workshops.
Nevertheless, I slowly learn using the guidance and resources of all of you JASP team and mentors of the forum.