

Can I make a multi-vari chart in JASP?

Hello,
I'm new with JASP, and I'm not a scientist or statistician. I worked in an engineering test lab, and as a technician I used statistical programs for comparing test data visually.
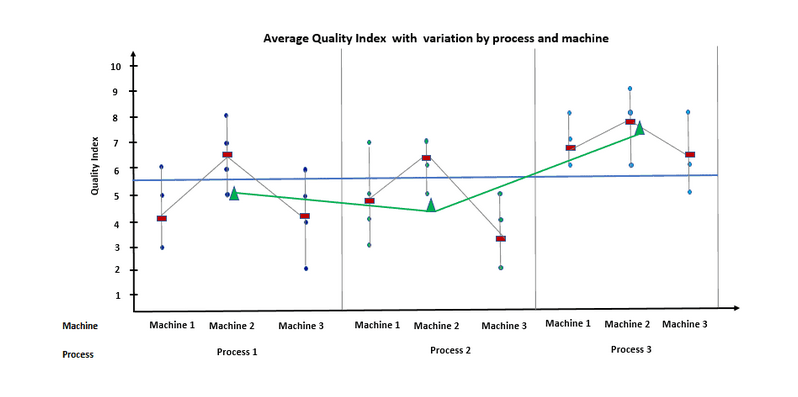
Specifically, we used multi-vari charts in just about every lab report we submitted. In JMP software they call them variability charts. I believe Mini-Tab calls them multi-vari, as do the Six Sigma people. I am wondering if these charts can be created in JASP 0.95.0. I am attaching a sample chart from the Six Sigma Study Guide.
I am thrilled to find JASP, with which I am really impressed, especially now that I don't have a commercial license for the big guys.
Thank you.
Comments
Hi @hartscontent As far as I can tell they are not implemented yet. But, another user recently made the initial request, I alerted the team to your further interest. You can track progress here on GitHub [Feature Request]: Add the ability to make Variability Charts like in JMP · Issue #2556 · jasp-stats/jasp-issues.
I will add I am only a user, and moreover a psychologist, (not sigma person!) but this should point you in the right direction!
Best,
Tarandeep
Thank you very much, Tarandeep!