

Run Charts

Hi folks, first post on the forum.
I am a retired former Six Sigma black belt who likes to dabble with data as a hobby, especially combining this with my love of classic cars. In that spere I've developed an analysis process to take data gathered by a cars ECU and process the data to give owners feedback on how to proceed with issues related to their specific vehicle, in comparison to the 100's of other I have data for. Specically this is on V8 cars running 14CUX ECU's as fitted to many Range Rovers, Morgans, TVR's, Marcos' etc
The process involves taking the data into MS/Access, processing it there to create new fields and export the data. Once processed I've been using JMP. Alas recently lost that software as I switched to a new PC.
Now for my questions
- Whats the best format of data to import into JASP ?
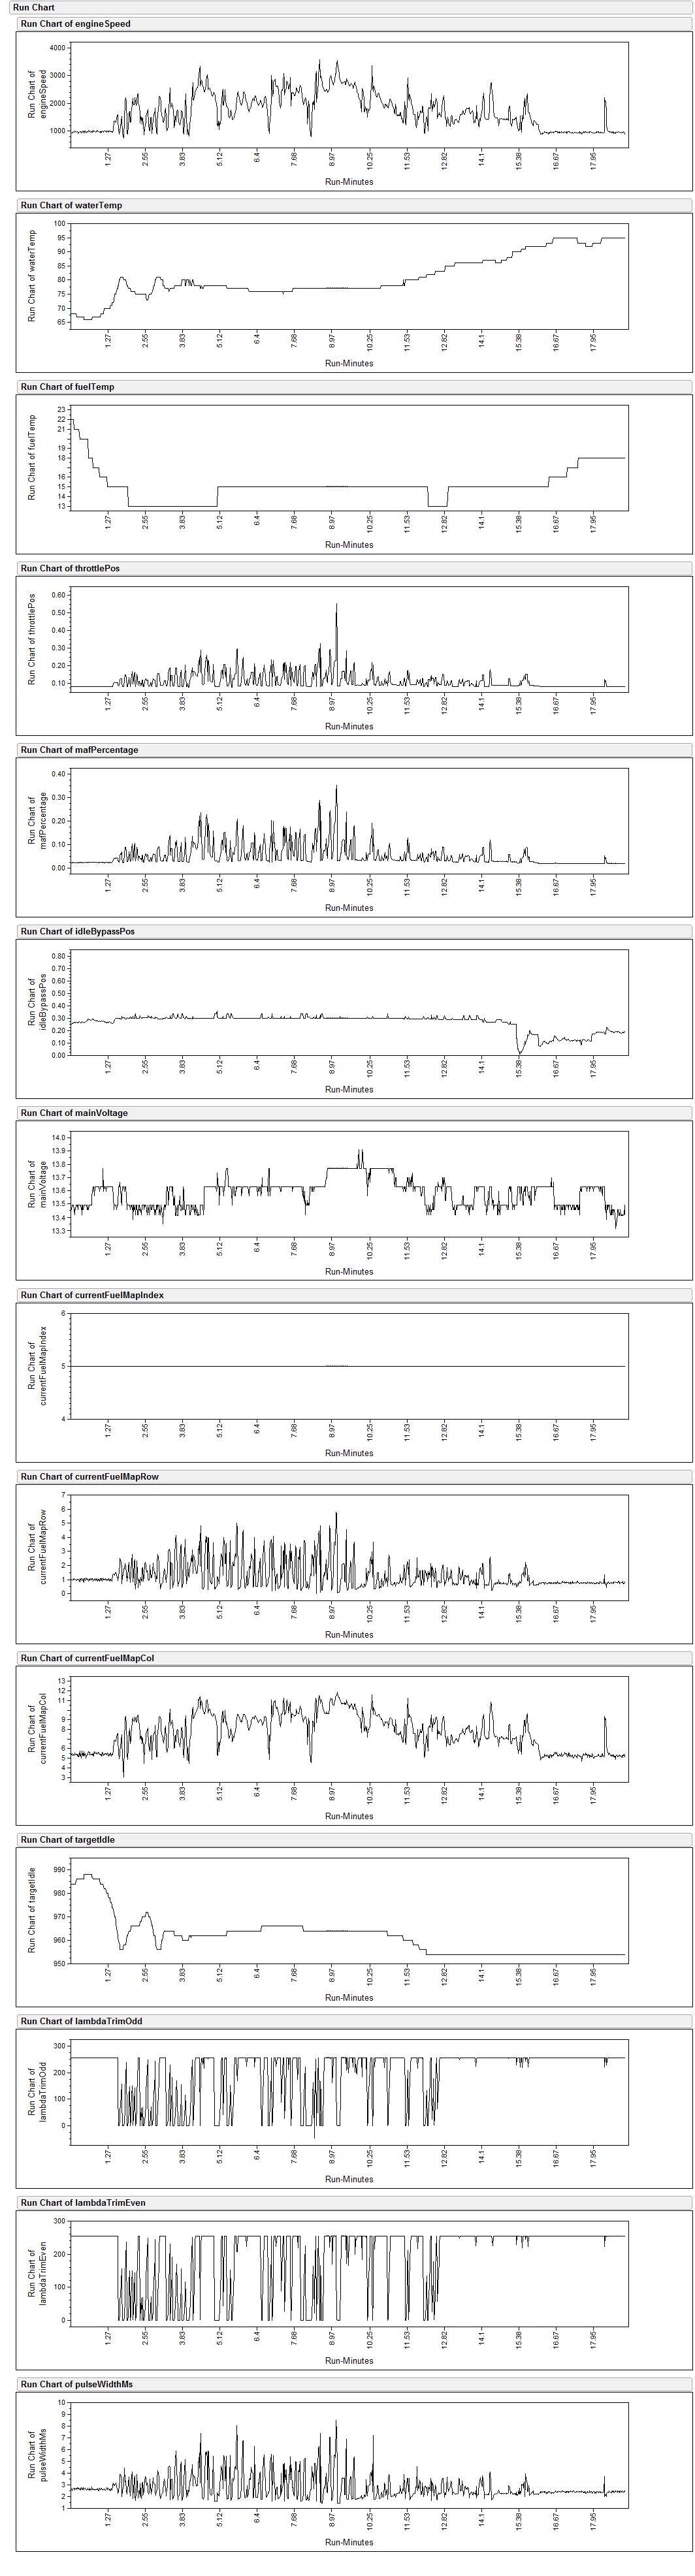
- How can I create Run Charts in JASP with multiple variable (about 15)
- How can I create Distribution analysis in JASP of those variables
attached run chart as example
If anyone can point me to where there are online tutorials that would be great.
Looking forward to the replies and happy new year to you all
Best regards
Frank (in UK)
Comments
Hi Frank,
Sorry about the tardy reply.
EJ