


EFA factor plot arrows

Hi,
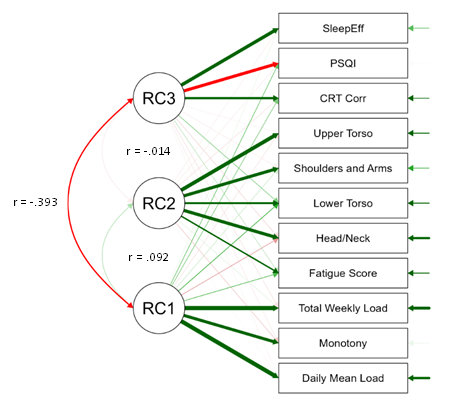
I'm conducting an exploratory factor analysis (EFA), and I'm struggling to find any information about what the green arrows represent on the right hand side of each variable in the factor plot (below).
Could someone assist with this?
Thanks
Comments
they're residual variances
Thanks, so how should I interpret those arrows in relation to the residual variances? Are thicker/darker arrows indicative of more/less problematic variances? Do these relate to the residual matrix?
What should the reader infer from these arrows?
I believe the standard in the field is thicker arrows = higher values. You could find tutorial papers/coursebooks, but I would just ask an LLM. If you are still in the dark, let me know and I'll ask a team member to point you to relevant literature.