JASP: Boxplot outliers are... 3 SD from mean or?

I would like to know how JASP identifies outliers when using the box plot function. Are they 3 SDs from the mean? 2? Is standard error used? Thanks!

It looks like you're new here. If you want to get involved, click one of these buttons!

I would like to know how JASP identifies outliers when using the box plot function. Are they 3 SDs from the mean? 2? Is standard error used? Thanks!
Comments
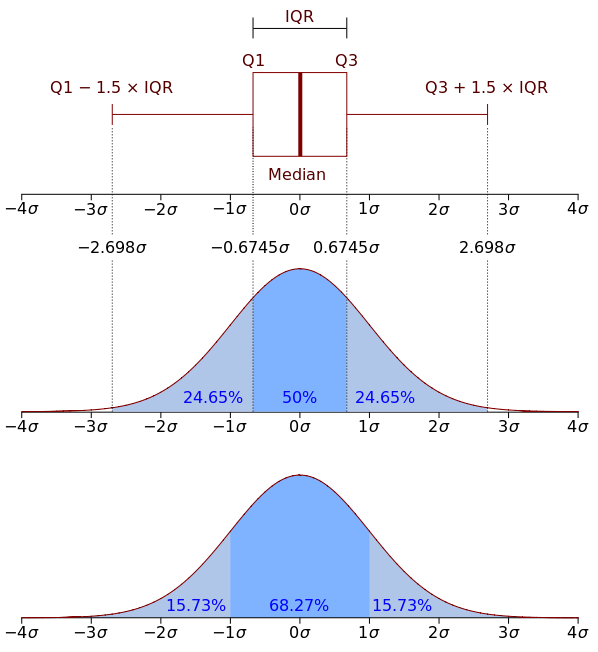
JASP uses the standard R code for boxplots. Typing ?boxplot in R gives the specifications. Outliers are values that extend beyond the whiskers. The whiskers depend on the argument "range". From the R documentation on "range": "this determines how far the plot whiskers extend out from the box. If range is positive, the whiskers extend to the most extreme data point which is no more than range times the interquartile range from the box. A value of zero causes the whiskers to extend to the data extremes." The default value for range is 1.5.
Cheers,
E.J.
Courtesy of Erik-Jan van Kesteren, the underlying R code:
v <- plotDat[plotDat$group == level,]$y quantiles <- quantile(v, probs=c(0.25,0.75)) IQR <- quantiles[2]-quantiles[1] plotDat[plotDat$group == level,]$outlier <- v < (quantiles[1]-1.5*IQR) | v > (quantiles[2]+1.5*IQR)
and the associated graph: