How to report the results of anovaBF.
My apologies if this has already been asked; I couldn't find any answer. I'm new to Bayesian inference, and I've been trying to use BayesFactor. I am reading Bayesian analysis of factorial designs (Rouder, Jeffrey N., et al., 2017) and though it is very useful, I didn't quite understand some parts.
First, on page 30 it says: "Consider the 15th model, which is [...]. The Bayes factor is the comparison of this model against the null model with no age effect, and this age-effect model is less preferable to the null model by 0.69-to-1"
The line on the output looks like this:
Bayes factor analysis
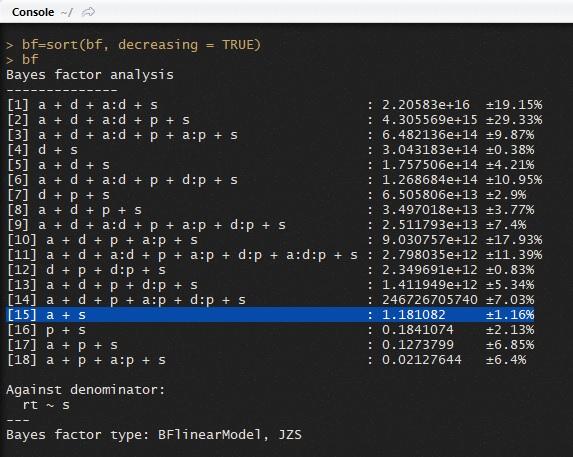
[15] a + s : 1.181082 ±1.16%
And here is an image of the console:

How do I get that .69-to-1?
Second, to report Bayes factors, I read the classification of Harold Jeffreys (1961). He said that BF_{10} > 100 is Extreme evidence for H1. Are the numbers of the second column this BF_{10}? Would this mean that all models from 1 to 14 are strong evidence in favour of the H1?
Could model 1 be interpreted as strong evidence of an effect of age and distance, and is it correct to say that model 18 shows _extreme evidence_of the lack of distance effect?
Third, how can I report this last part? Saying that the best model predicts the data 1.0404717e+18 times better than the model including distance?
Sorry for the very long post. Any reading suggestions on how to report and interpret the results in R using BayesFactor is welcome.


Comments
I will leave this one for Richard to address.
Hi Aram,
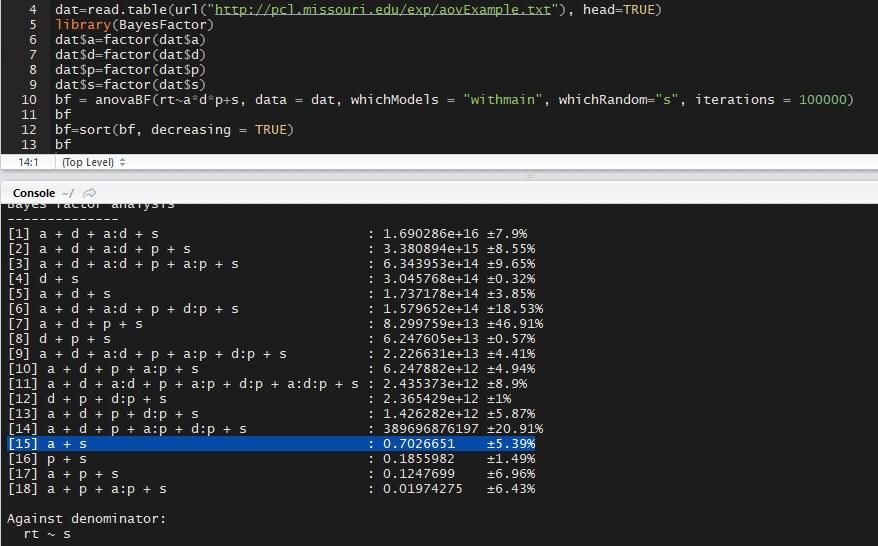
I'm not sure how to reproduce what you did because you did not provide code, but when I load the data and run:
I get
Notice that model 15 is not exactly .69 to 1 due to the Monte Carlo sampling used to estimate the Bayes factor, but it is close.
As to interpretation, you can think of the numbers in the middle column -- the Bayes factors -- as (roughly) being "improvements" in the denominator model listed at the bottom. If the number is greater than 1 it is an improvement on the denominator model; less than one, and it is not. The rows with very large numbers
are big improvements on the denominator model.
But you probably want to know more; like, are any simpler models improvements on the full (most complex) model? Since model
[18]inbfis the full model, you can try:which will yield:
Notice that many of the simpler models appear to be "improvements" on the most complex model, some by a considerable amount.
You could also see how much worse other models are than the "best" model, with:
if you like.
(I'd also like to point out the high error estimates in the example; before one made any decisions about reporting these data, it would be prudent to try to reduce the error through more iterations; say, 100000 or more)
Thank you both.
Richard, I did it again and got almost the same number, so maybe I did something wrong the first time:

Now it makes sense. So the normal thing to report is the ratio, the Bayes Factor and the errors of the models one is interested in?
By the way, thanks for BayesFactor! So useful
I wouldn't bother reporting the error, provided you get it sufficiently low that it seems trustworthy. Try
and look at the red error bars to see if you have reason for concern.