Comparing results of a 3-way mixed ANOVA with a Bayesian 3-way mixed ANOVA
Dear colleagues,
I am very new in Bayesian statistics and have got some questions about how to interpret the results of a three-way mixed Bayesian ANOVA (including factors TIME, GROUP, TASK), in particular in direct comparison to an “orthodox” 3-way mixed ANOVA.
Since my results of an “orthodox” 3-way mixed ANOVA revealed significant as well as not significant main effects and interactions, I am requested by reviewers to perform a Bayesian repeated measure ANOVA. To do so I used JASP, which is a very nice and intuitive tool. Thanks to the developers!
The results of the 3-way mixed ANOVA revealed a significant main effect of TIME (p < .001), but no significant main effect of GROUP or TASK (p > .05). Further a significant three-way interaction emerged between TIME * GROUP * TASK (p = .024) as well as a significant two-way interaction emerged between TASK * GROUP (p = .005). All other interactions are not significant (p>.05).
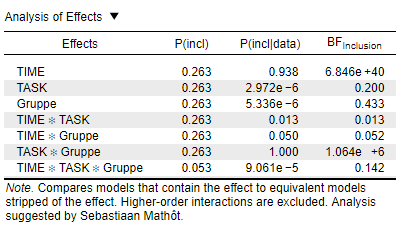
However, the results of the Bayesian repeated measure ANOVA revealed a slightly different result as indicated in the following table Analysis of Effects (BF10 ; across matched models).

JASP Team (2018). JASP (Version 0.8.6) [Computer software].
Am I right, that the BFInclusion indicated decisive evidence for HA for the factor TIME (6.846e+40) as well as for the two-way interaction of TIME*TASK (1.064e+6). But the small value of the BFInclusion for the three-way interaction (0.142) indicate substantial evidence for H0 (an conversely indicate substantial evidence against HA)?
And if my description is right, how do I report and interpret this conflicting result (significant 3-way interaction vs. substantial evidence against this 3-way interaction as indicated by BFInclusion = 0.142) ?
It will be great, if someone can help me! ![]()
Cheers
Nils


Comments
Hi Nils,
Yes, your interpretation is correct. The analysis of effects model-averages across a range of models. You could also look at the standard table and compare the the full model with the model that includes only the two-way interactions. Plotting the data for the different groups separately might also help shed some light on this.
Cheers,
E.J.
Hi E.J.,
Thanks a lot for your quick and helpful answer! I will also try your further advices and hopefully can gain more insights into that analysis.
Cheers
Nils