

Sequential analysis plot error

Hi, I ran several Bayesian t-tests but one of them did not produce a sequential analysis plot - instead it gave an empty figure saying 'legend is of length 0'. I've attached a screenshot.
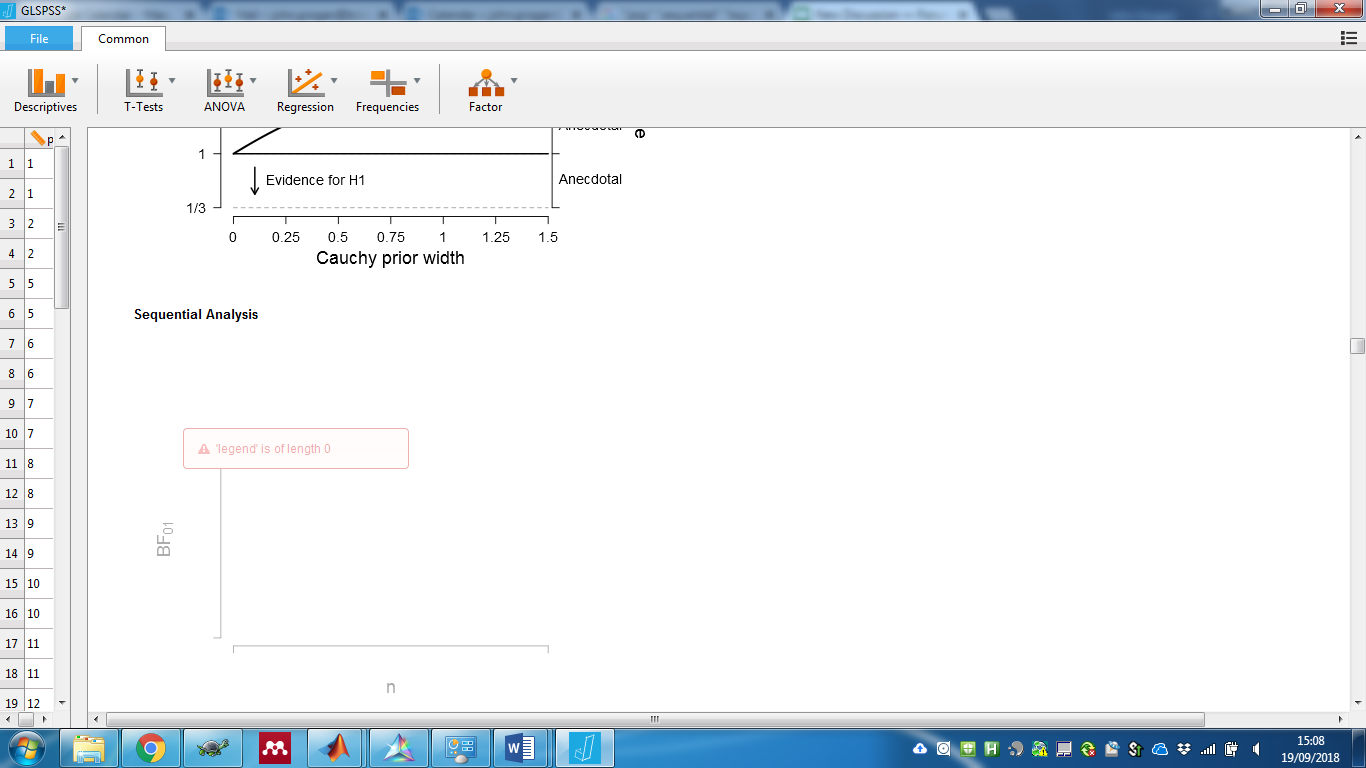
I don't seem to have any missing data or odd types of data in those columns, so am not sure why it is just that one figure that is messed up when all the other variables produce it fine.
Does anyone know why this would happen and how to fix it? thanks
Comments
That's strange. I hope you can post this issue on our GitHub page -- this way the programmers immediately see it and can respond effectively. For details see https://jasp-stats.org/2018/03/29/request-feature-report-bug-jasp/