

Logger auto-filling spaces and not logging certain RT

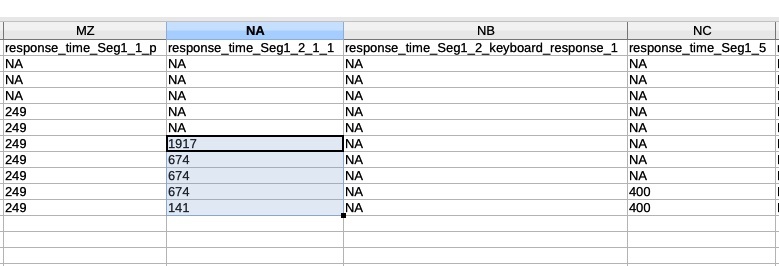
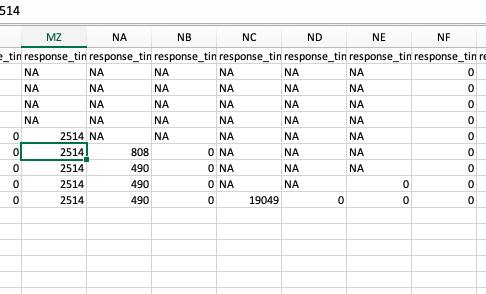
My experiment runs fine but when I open the files in excel or libre office, the data is really hard to read. Originally I had a keyboard response after each sketch pad, the data was recording in different columns which was fine, but it was recording it in rows where it shouldn't. The number would appear in squares for the practice responses and would be dragged all the way down. Then in the next column the number was also appearing in the wrong rows. There are two different numbers but they are both initially in the wrong spots. Since I noticed that the numbers did not drag down when another log was there I changed my experiment so that there was only one keyboard response for the 4 sketchpads. This caused all the data to appear in one column, but it seems like some data might be overwritten or not included. I've attached the screenshots from the different excel files. Any help would be greatly appreciated.
Comments
This is solved.