

What‘s going on with the tiny grey line in this graph?

Hi everyone!
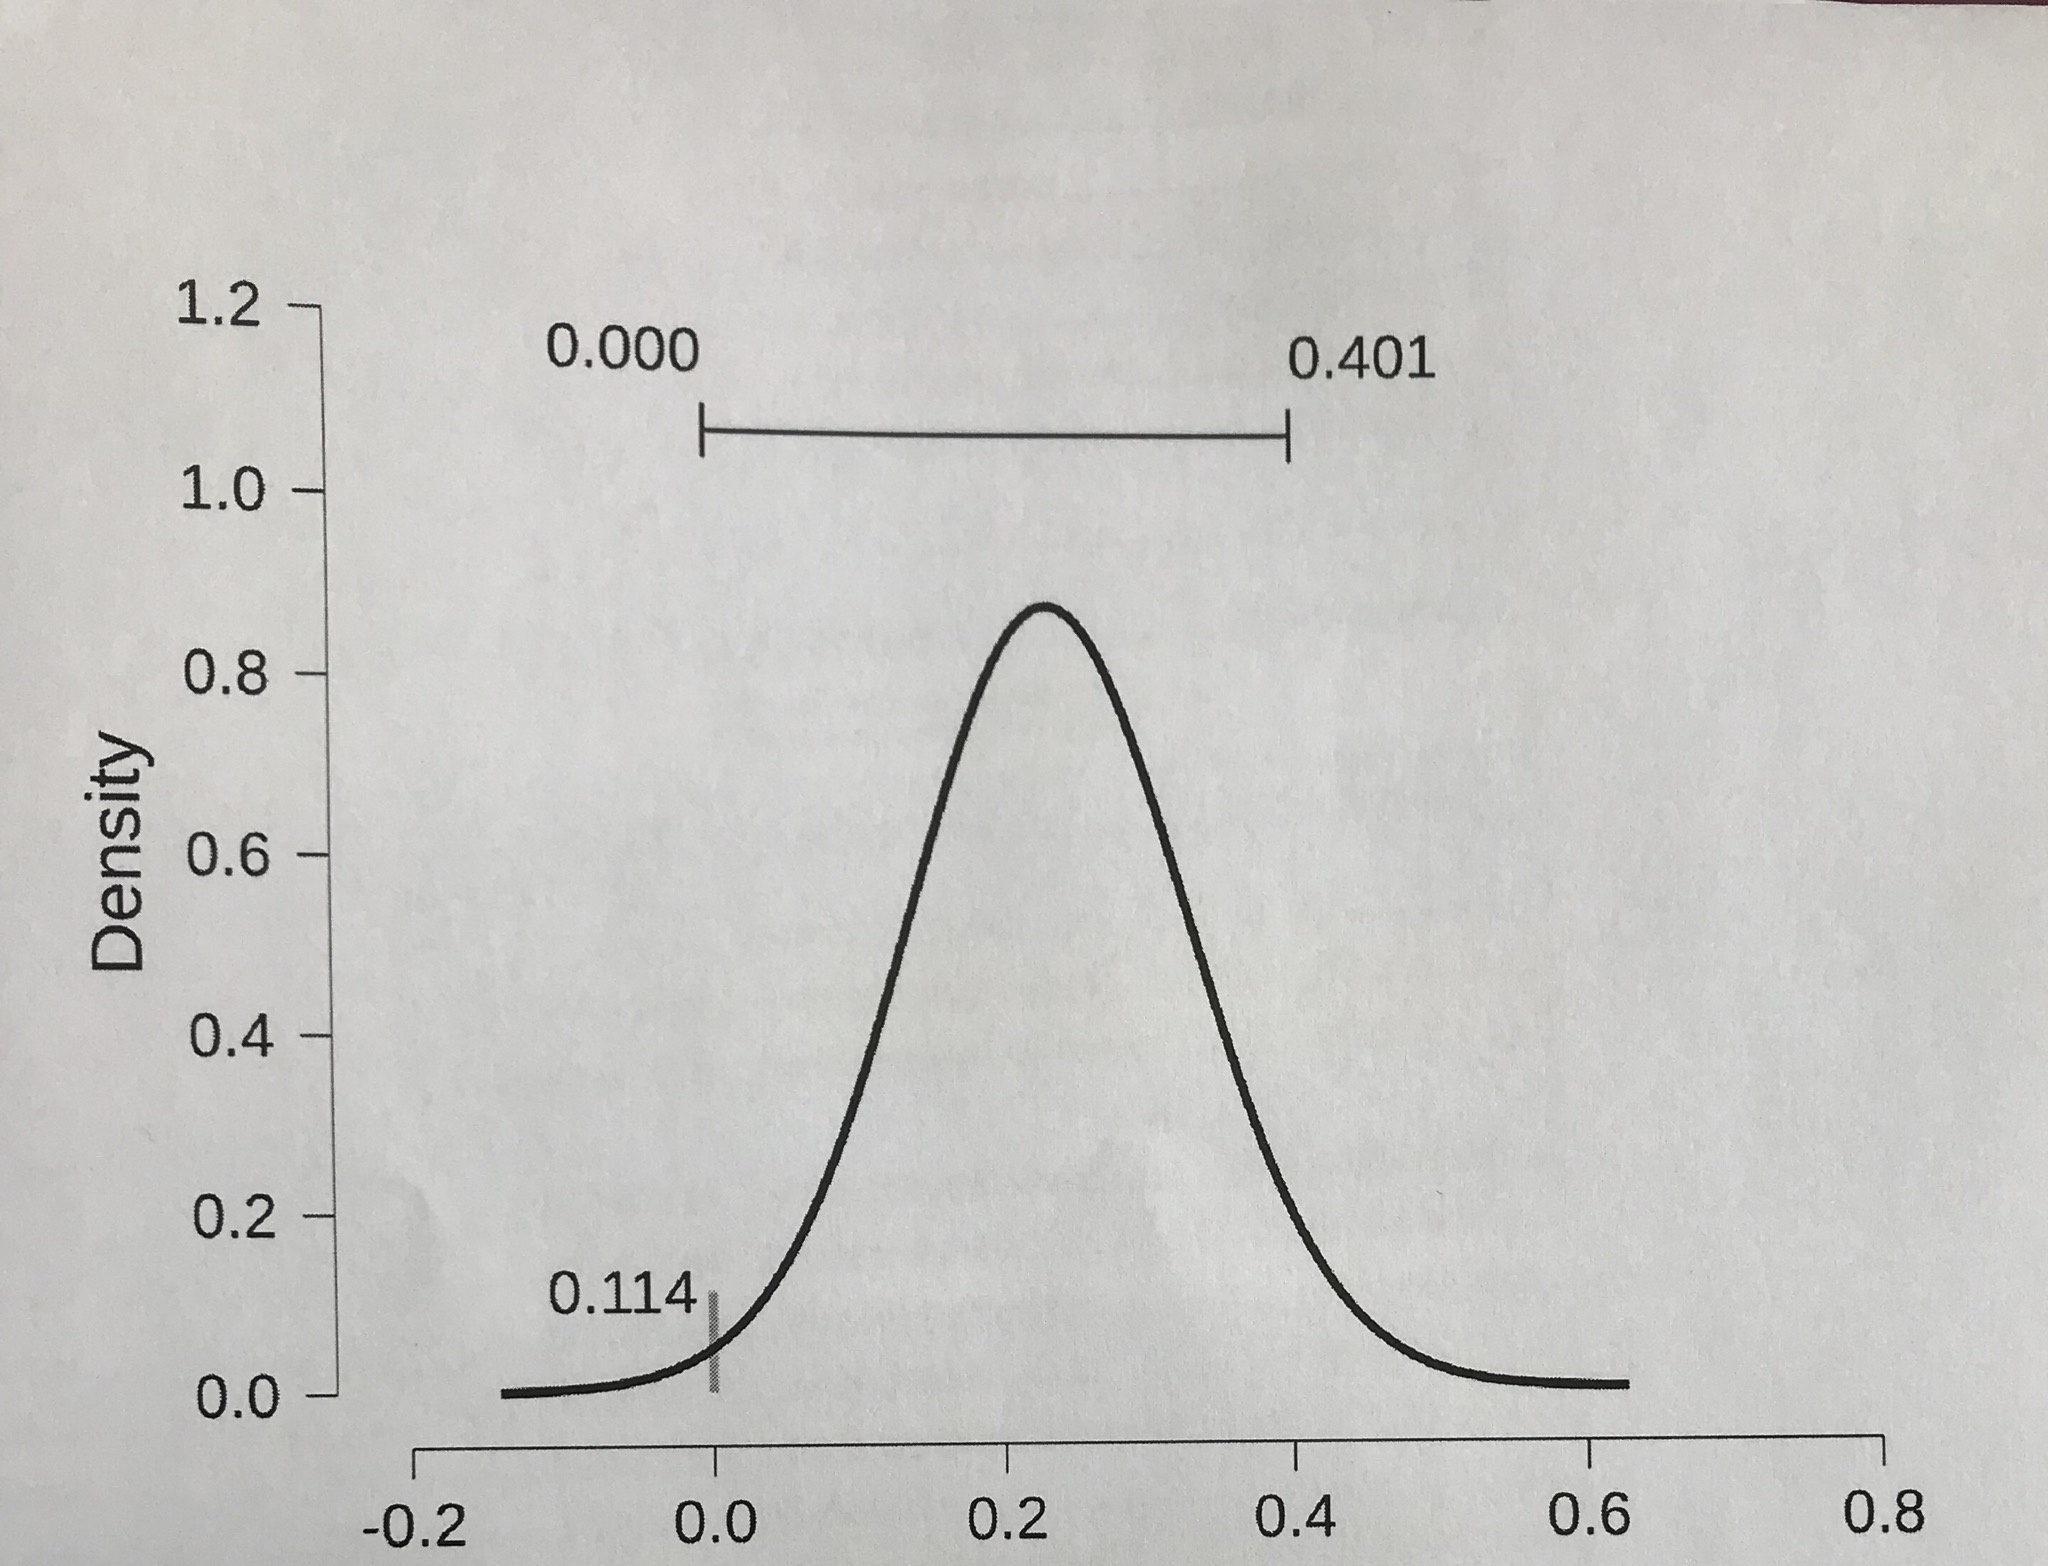
If my memory serves me correctly, the vertical grey line indicates that the probability of my coefficient being exactly 0 is 11.4%. The credible interval tells me that my coefficient lies between 0 and 0.401 with 95% certainty. However, in this case...shouldn't the vertical bar and the black curve meet in the same spot? As in, the black curve at x=0 should also be at y=0.114, like the grey line indicates?
Thanks for helping me understand! :)
Comments
Or is this supposed to be the Savage-Dickey density ratio?
Never mind, after ages of Googling, I found my solution: https://cran.r-project.org/web/packages/BAS/vignettes/BAS-vignette.html
(Through Google image search...)
Yeah so the height of the vertical bar refers to the model in which the coefficient is zero; the density of the solid line is under H1, the model in which the coefficient is not zero. Because it is a density, the height at any one point does not refer to a probability (which is the area under the curve)
E.J.