

(JASP) interpretation of sequential analysis

Hi all, I did some searches to try and figure out how to interpret the sequential analysis panel that is generated by JASP (I'm looking at the bayesian one sample t-test for now) but I can't see to find much, past a suggestion that looking at it would be informative (whatever that means).
Here is an example I'm running, where I input my test value at the actual mean of the dataset I'm analyzing
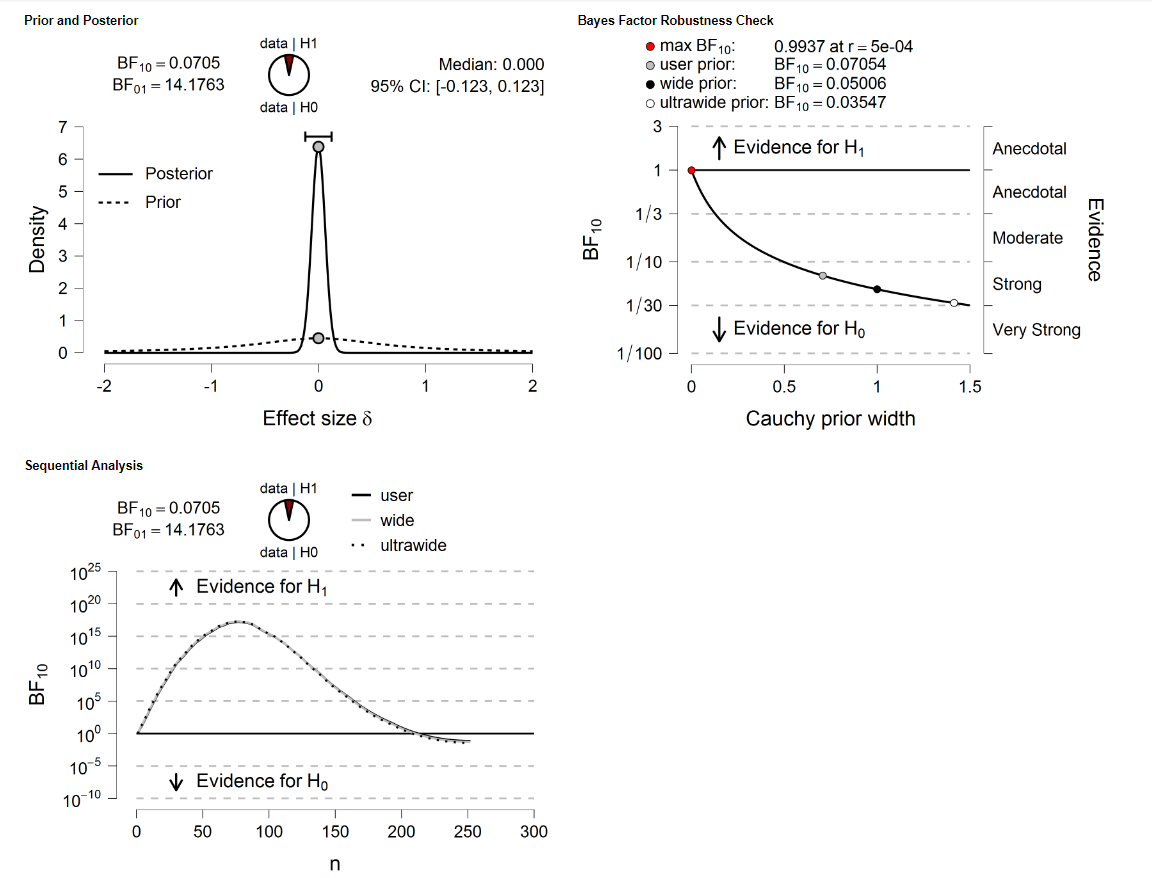
From another post in this forum, I found out that the sequential analysis uses sequential adding of observations, in the same order as the data are found. This suggests to me that in my data, the first half of the data is very skewed away from the mean of the whole dataset. Is there any other interpretation of this graph? I'm looking at data that is not by its nature sequential, so if that's the case, is this plot not useful at all?
I originally was hoping that this was a way of projecting the possible result of increasing sampling. Put another way, is there a way to forecast how many MORE observations I need, or if I've reached saturation? Pardon the naiveté of my question, I'm still working my way through some early intro books on bayesian statistics before I decided to just dip my toes in it.
Thanks for any help you can provide!
Comments
Oops, I just wanted to amend, that the example I posted above was just playing around with the data. Perhaps what confused me about the sequential analysis is when I test a dataset whose mean is definitely different from my test value, and this is what I get:
This makes intuitive sense to me, whereas I feel like in the above first test, I should have seen fluctuations around BF10=1
Dear blin100,
The first sequential plot you showed (where the evidence first goes up a lot, and then goes down) is really anomalous: you would get this if the first half of the data showed a massive effect, and the second half showed an equally massive effect, but in the opposite direction. You might want to analyze the first 75 observations and the remaining observations separately to diagnose the issue.
The second sequential plot is typical, in the sense that when there exists a clear effect, the evidence shows a steady march towards higher values as the data set increases in size.
As far as projection into the future is concerned, we do not offer this yet but it is very much on our radar.
Cheers,
E.J.
Hi EJ, thanks very much for the clarification. It turns out in the processing of the columns, I had sorted a column by size, and so the input was actually ordered.
Regarding future projection, is that the phrase that's used for what I'm asking?--which is do I have enough n for a reliable BF/does the data show no trend towards strong evidence?
i'm having a hard time searching for texts to do this, except for a brief paragraph in a publication that points out this advantage in using bayesian statistics.
Thanks again!
Brian
Hi Brian
As far as projection is concerned, that's the term I use (with Angelika Stefan and Felix Schoenbrodt, who are working on this as well); the method is not often applied (yet). It is basically a Bayesian power analysis "on the fly", where you update as the data come in.
Cheers,
E.J.
Ahh, gotcha, thanks very much!