

Path Plots in Mediation Analysis & Covariances

Hi everyone!
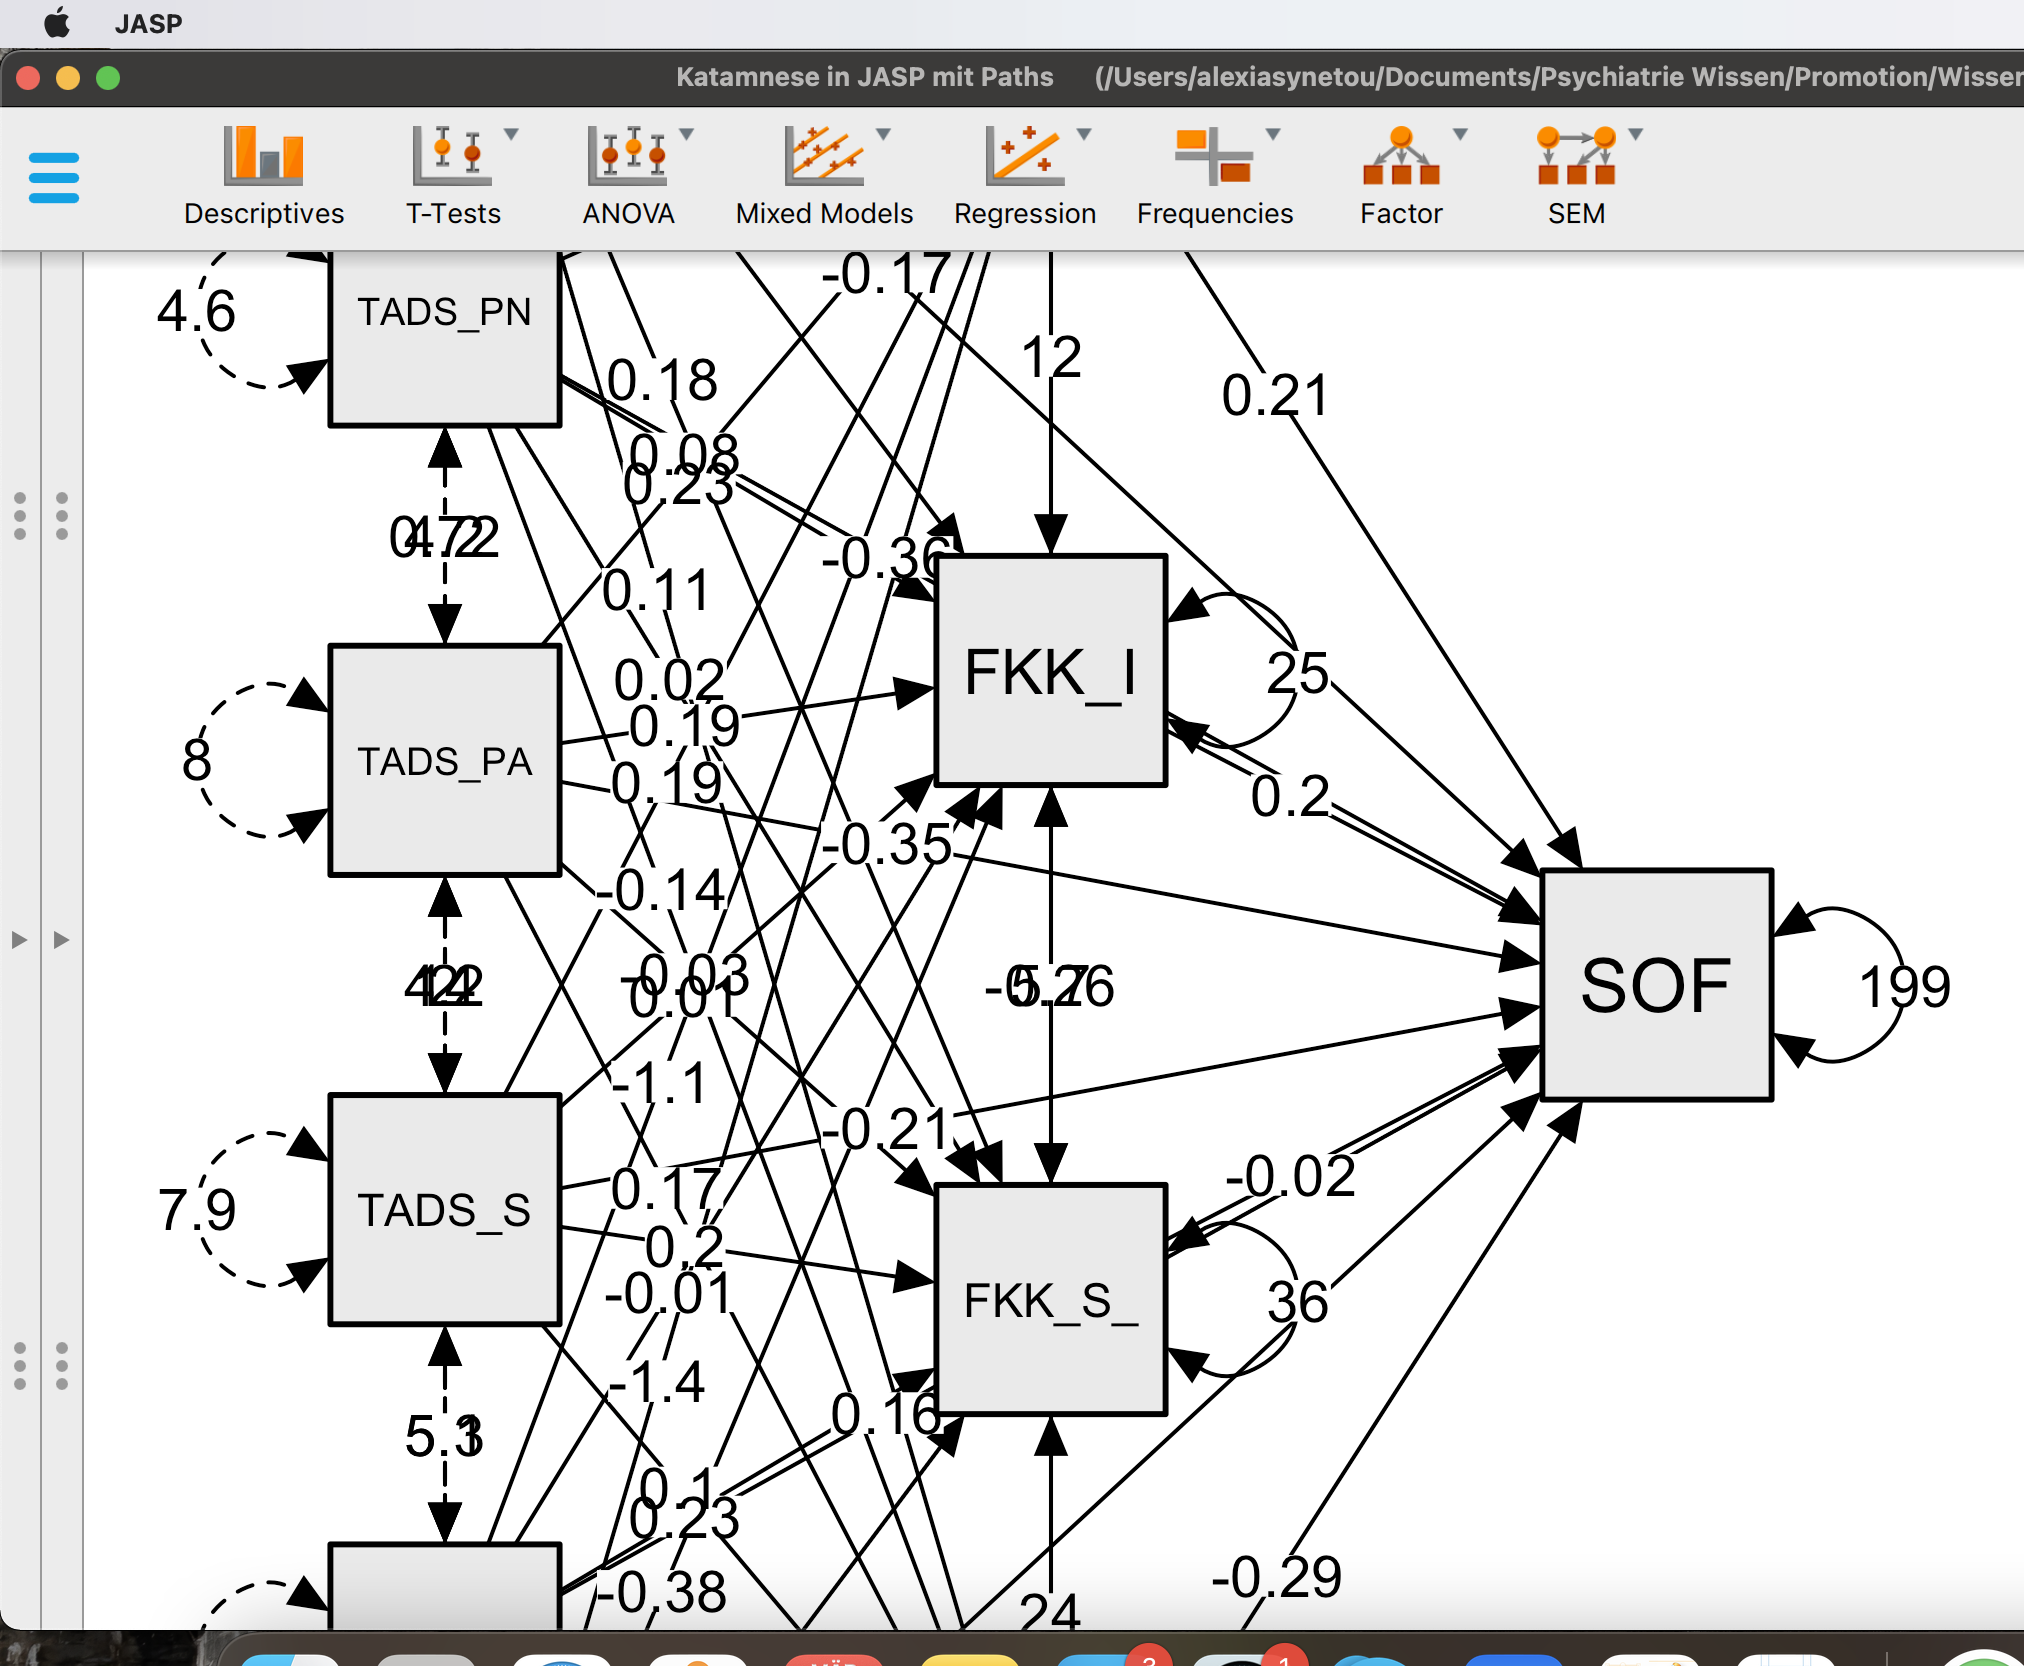
I am really inexperienced in statistical analysis and I am trying to test some mediation models. The path plots that are produced through the model contain numbers, that one cannot read. I tried to enlarge the paths, but the problem remains. I have added some photos for you to see. Also although there is a table with the covariances between the mediators I cannot create a table with the covariances between different predictors (factors). Thank you in advance!
Comments
Hi @alexiasn91,
Thank you for your question!
I do see that numbers are overlapping a lot in your screenshot. The JASP presents a path plot based on the R package
semPaths, so the functionality to avoid overlapping estimates is limited at the moment.Regarding the covariance between different predictors, you are right in that there is no option to see covariances between predictors in the current version. However, there is a 'trick' that you can try to have a table about them. You could try the steps below (I tried to be detailed for you, but please let me know if anything is unclear):
Please let me know if additional questions come up.
Cheers,
Ihnwhi
Hi @alexiasn91,
Thanks for your question.
I do see that a lot of overlapping numbers in your screenshot. JASP presents path plots based on the R package
semPaths, so the functionality to adjust numbers to avoid overlapping is limited.Regarding the second question, you are right in that there is no option to have a table with the covariances between different predictors for mediation analysis in the current JASP version. However, there is a trick you can try. I tried to describe each step in detail, but please let me know if you find anything unclear. Please follow the steps below.
Hope this helps.
Cheers,
Ihnwhi