Mousetrap -- can't re-create the trajectory graph with the same old R code and data
Hi Pascal,
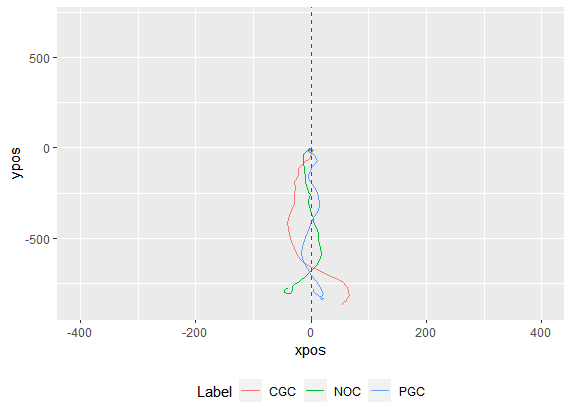
I've piloted some mouse-tracking data with PC Ibex this February. I used to be able to produce somewhat similar graphs as in this example (http://pascalkieslich.github.io/mousetrap/reference/mousetrap.html). However, when I tried to reproduce the graph yesterday, something went wrong and the graph doesn't look normal anymore (see below). I'm not exactly sure what went wrong and could you point me some directions? Thank you so much!
The following are the three critical columns of the first row the raw data [dataframe name: clean_data], which I then imported to mousetrap using mtdata <- mt_import_mousetrap(clean_data).
timestamps: [0, 1440, 1448, 1458, 1475, 1492, 1508, 1525, 1542, 1558, 1576, 1592, 1609, 1625, 1642, 1658, 1675, 1692, 1708, 1725, 1742, 1758, 1775, 1792, 1808, 1825, 1842, 1859, 1875, 1892, 1908, 1925, 1942, 1958, 1976, 1991, 2008, 2025, 2042, 2058, 2075, 2092, 2109, 2125, 2142, 2158, 2176, 2192, 2208]
xpos: [1278, 1278, 1278, 1278, 1278, 1279, 1279, 1280, 1281, 1283, 1285, 1290, 1294, 1299, 1307, 1317, 1329, 1343, 1358, 1375, 1397, 1423, 1450, 1480, 1535, 1575, 1612, 1645, 1673, 1698, 1728, 1748, 1760, 1772, 1783, 1787, 1797, 1801, 1805, 1810, 1814, 1818, 1819, 1820, 1821, 1822, 1822, 1822, 1822]
ypos: [1297, 1297, 1297, 1296, 1296, 1295, 1295, 1293, 1291, 1289, 1286, 1278, 1271, 1262, 1251, 1238, 1221, 1201, 1179, 1154, 1120, 1077, 1027, 971, 874, 794, 718, 654, 601, 554, 495, 439, 397, 351, 311, 301, 286, 279, 270, 261, 251, 243, 239, 237, 236, 235, 233, 232, 231]
Peiyao


Comments
Hi Peiyao,
without knowing the complete dataset I can only guess. However, from what I see in the figure I assume that this represents a plot of aggregate trajectories, probably creating using mt_plot_aggregate?
If this is the case, I assume that what you mean wth strange is that the aggregate trajectories seem to "end" somewhere in the bottom center. This might be the case because you are trajectories that have not been remapped which is why some of the individual trajectories end on the left and some on the right (making the aggregate end somewhere in the middle). Similarly, they might end in the bottom because the coordinate system in the raw trajectories has y coordinates that decrease as the cursor moves upwards.
If all these assumptions are correct, you should probably simply call the following 3 functions in a row:
mt_import_long
mt_align_start
mt_remap_trajectories
(which is exactly what is happening in the example code you mentioned - however, maybe this code is not run for you directly copied it from the homepage because of the "if (FALSE)" in the beginning which is there because this part of the example code is not run when producing the documentation).
Best
Pascal
Hi Pascal,
It turns out I accidentally switched the order of mt_align_start and mt_remap_symmetric. Now my script produces the old result.
Thank you for your help.
Peiyao