

Inconsistency in CI width for Bayesian repeated measures Anova

I have noticed that JASP puts different values for CI on the graph than those resulting from the analysis. I don't know if this is a bug or a feature ;-)
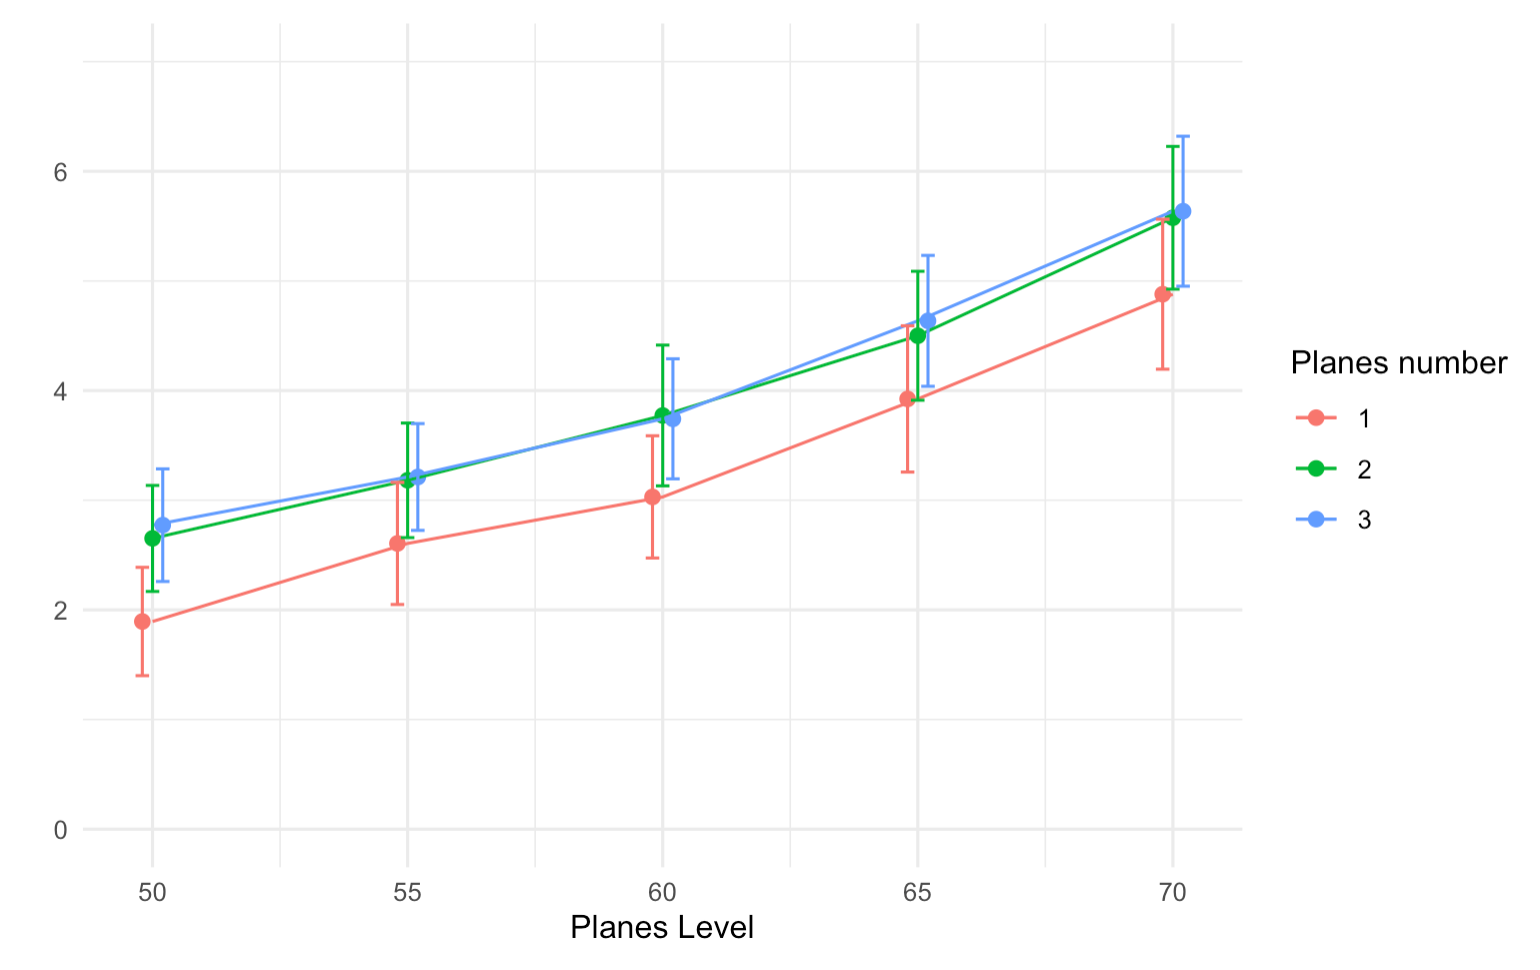
It is possible that I don't understand something, but these values on the graph in R look different.
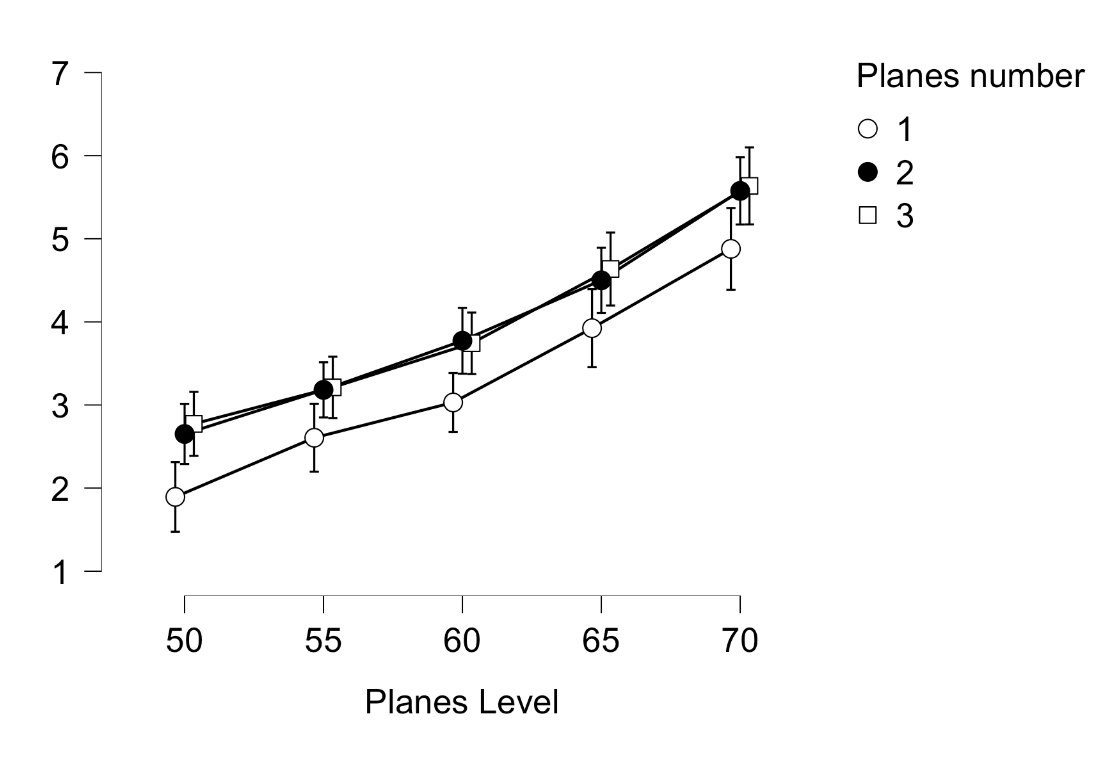
I attach the data and graphs
File is here: https://uam-my.sharepoint.com/:u:/g/personal/kleka_o365_amu_edu_pl/EZ524tJOuh1Fv70l17VK6AQBGEJsVP1FaYk72d9GXVtXDA?e=jvYVCJ
Comments
That is correct. The figure is meant to be descriptive, so it uses a flat prior (and therefore gives the same result as the frequentist confidence intervals). The complication with basing the credible interval on the model is that there are often multiple models in play. We can model-average across these (or have the user choose which model they ought to be based on), and maybe we should, but we haven't done this so far.
E.J.
Dear EJ,
Thank You for the answer - it is clear to me now what happens.
Paweł Kleka