

Scatterplot issue

Hi folks,
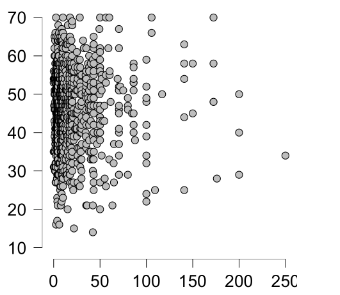
I'm currently conducting a bayesian correlation, and when I click Plot Individual Pairs -> Scatterplot, I get this:

Which is not a scatterplot of my two variables. I can't quite figure out what it is; my sample size ~1100, which seems to correspond to the axis ranges, but I'm not sure what this is plotting. If I plot the same data using descriptive statistics -> scatterplots, I get an actual plot of the values:
Am I doing something silly, or missing something obvious about the scatterplot option in bayesian correlation? Just wanted to flag in case it was some sort of glitch.
Thanks!
Comments
Hmm this is really strange. It would be great if you could make an issue of this on our GitHub page. See https://jasp-stats.org/2018/03/29/request-feature-report-bug-jasp/. You are using JASP 0.14.1?
Cheers,
E.J.
Hi PeteE,
Thanks for reporting this. The scatter plot at the top visualises the ranks of the two variables. This was done to help better visualise ordinal data for which the face values of the raw data are meaningless. Ideally, the scatter plot of the ranks is displayed if under the "Plot Individual Pairs" section Kendall's tau is chosen. Similarly, the desired behaviour is that the scatter plot of the raw data is displayed if under the "Plot Individual Pairs" section Pearson's rho is chosen. Unfortunately, the behaviour of the scatter plot in 0.14.1 is currently less ideal.
What I believe happened is the following:
To get the scatterplot of the raw data and not the ranks, you can do the following:
My colleague Don van den Bergh fixed this problem for the next release, and added two improvements on this:
I hope that this helps.
Cheers,
Alexander