A Ferrari

Good morning
I use JASP to do repeated measures ANOVA but I have discriptives plots problem. The error bar are really to small to be the standard deviation (I did it on excel too..).
Is it possible to help me please ?
Regards,
A Ferrari

It looks like you're new here. If you want to get involved, click one of these buttons!

Good morning
I use JASP to do repeated measures ANOVA but I have discriptives plots problem. The error bar are really to small to be the standard deviation (I did it on excel too..).
Is it possible to help me please ?
Regards,
A Ferrari
Comments
Hi Ferrari,
Would it be possible to share the jasp file that created the descriptives plot? Without the, I'm afraid we're just shooting in the dark.
Cheers,
Don
Hi,
There are two groups on the statistic test (pr and po) and the repeated measures factors is the TIME.
Thanks !
Cheers,
A Ferrari
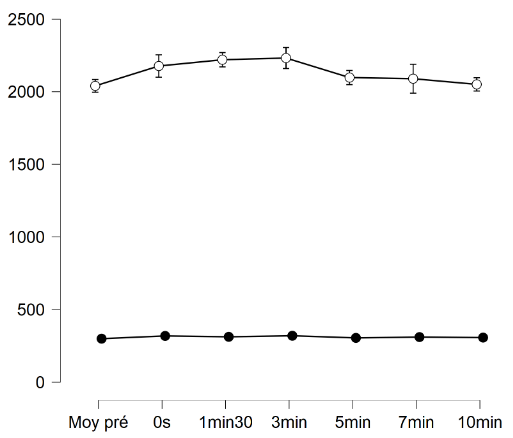
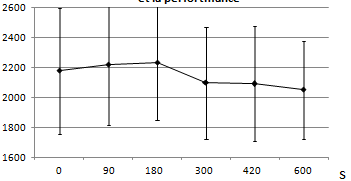
I'm getting this figure:
did you rescale the data by 1000?
The error bar are really to small to be the standard deviation (I did it on excel too..).
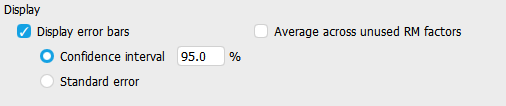
The error bars are not standard deviations, but confidence intervals or standard errors:
To compute the standard error, you divide the standard deviation by sqrt(N). So the error bars in JASP with standard error selected should be the mean ± SD / sqrt(N). For the confidence interval (which you have selected in your first post), you'd do mean ± 1.96 * SD / sqrt(N). Here the 1.96 is short for the 0.975 percentile of a normal distribution (you can get a more accurate number with
NORMSINV(0.975)in excel orqnorm(0.975)in R).I hope that resolves the difference, but let me know if it doesn't!
file:////home/dvdb/.JASP/temp/clipboard/resources/0/_3_t1630666875017.png