K-means clustering - Beginner help
Hello,
I'm new to Jasp and have to use it for my master thesis, and i'm facing some troubles. Here a some of my interrogations :
1- Is there any easy-to-use guide about k-mean clustering with detailled informations (and maybe step-by-step procedure) ? I'm still struggling with the understanding of the software.
2- More specifically on k-mean clustering :
2-1- Do scales have to be changed, or does JASP automatically change scales ? Can I use different scales, or do I have to use only one (for exemple, do I only have to use a Z-score scale) ?
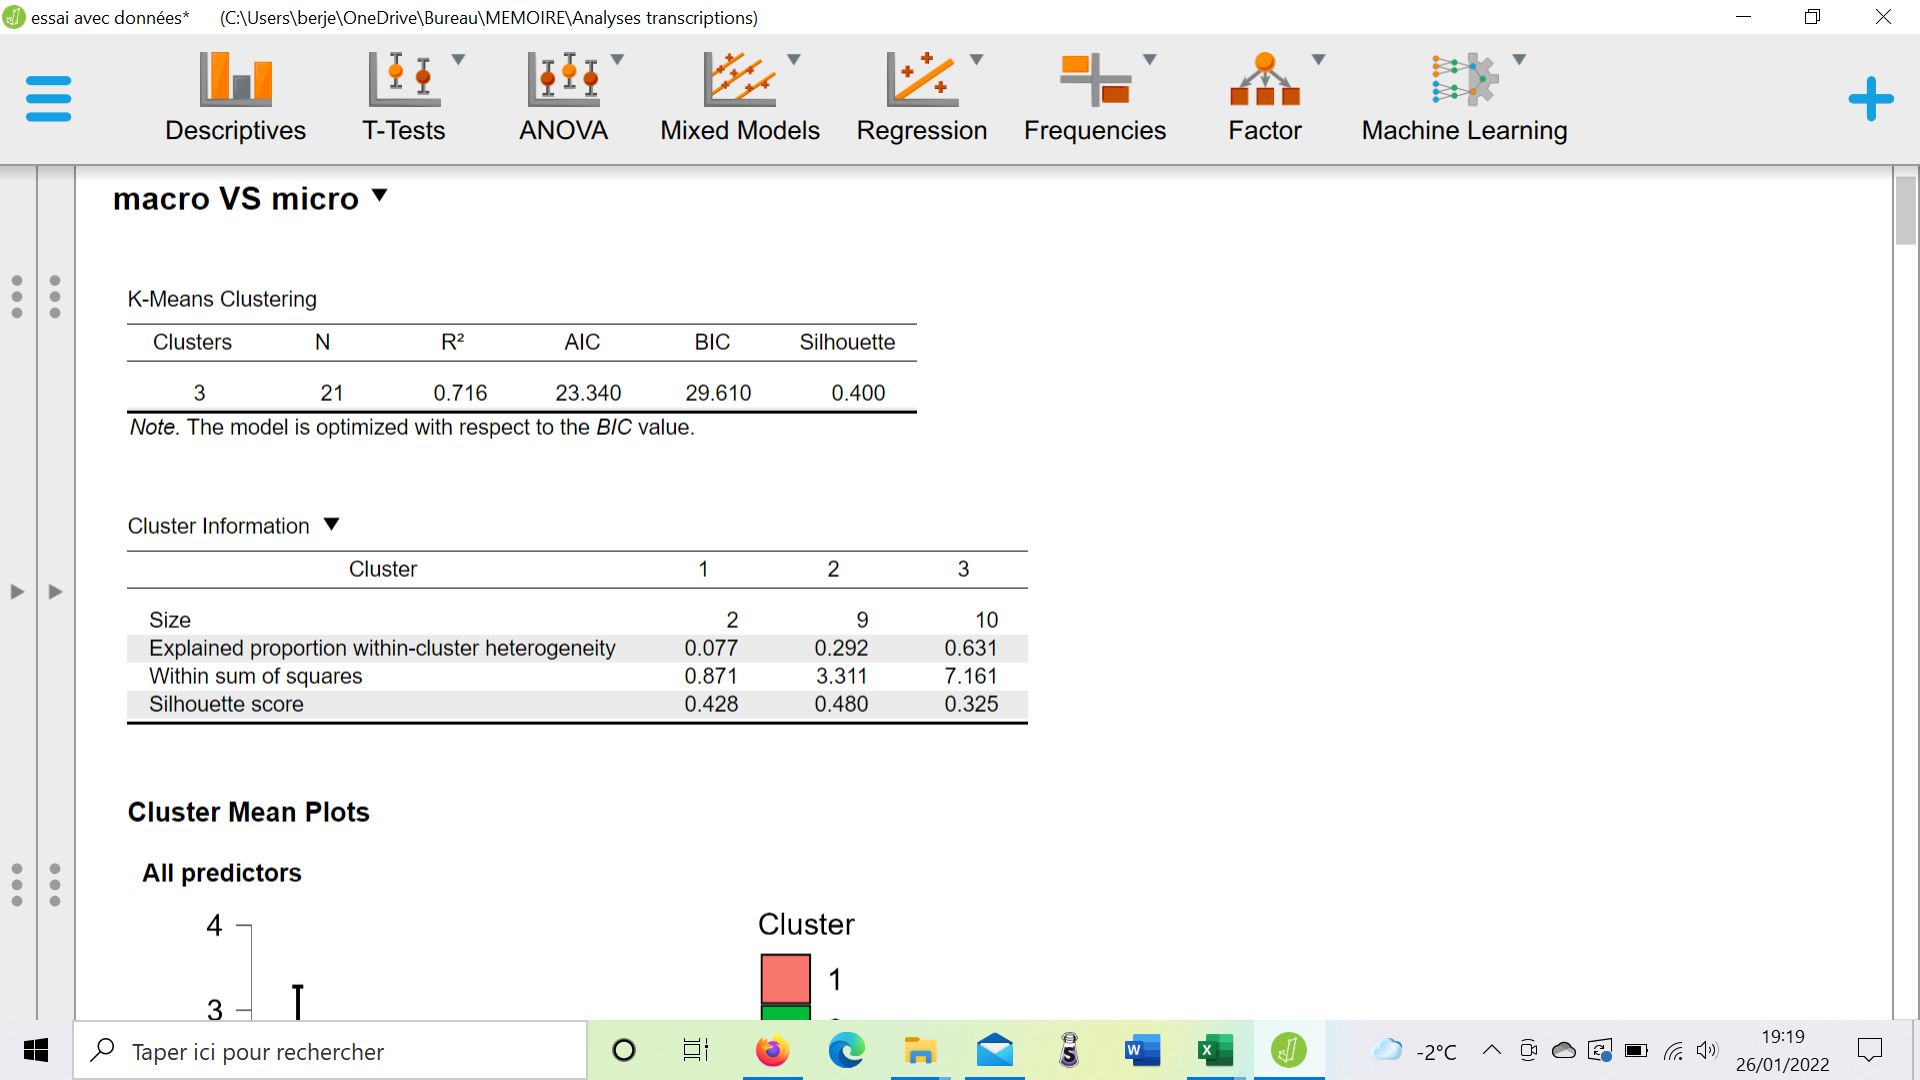
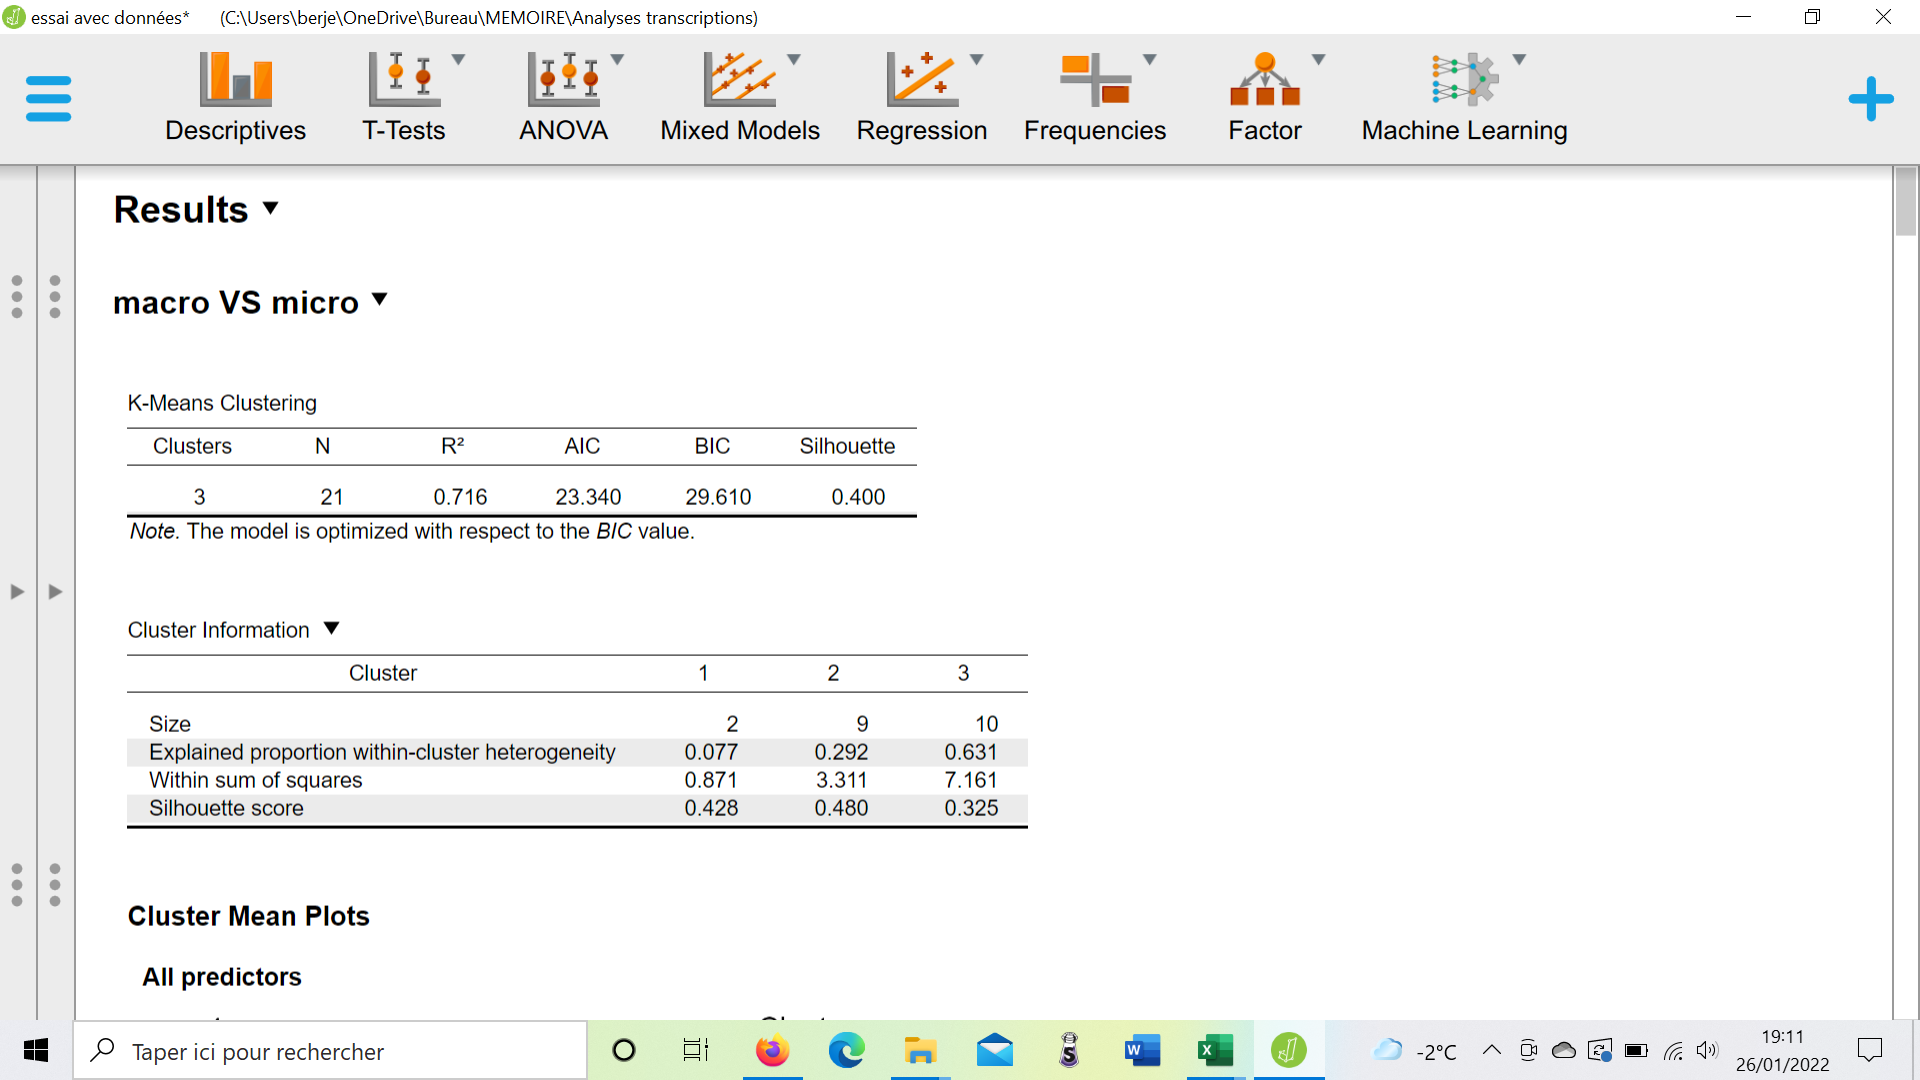
In the picture below, I'm using a scale on 35 and a Z-score at the same time, and the results seem automatically converted.
2-2- What kind of data do I have to input, between raw data and z-score, for k-mean clustering ? I tried both ways and dont get the same results.
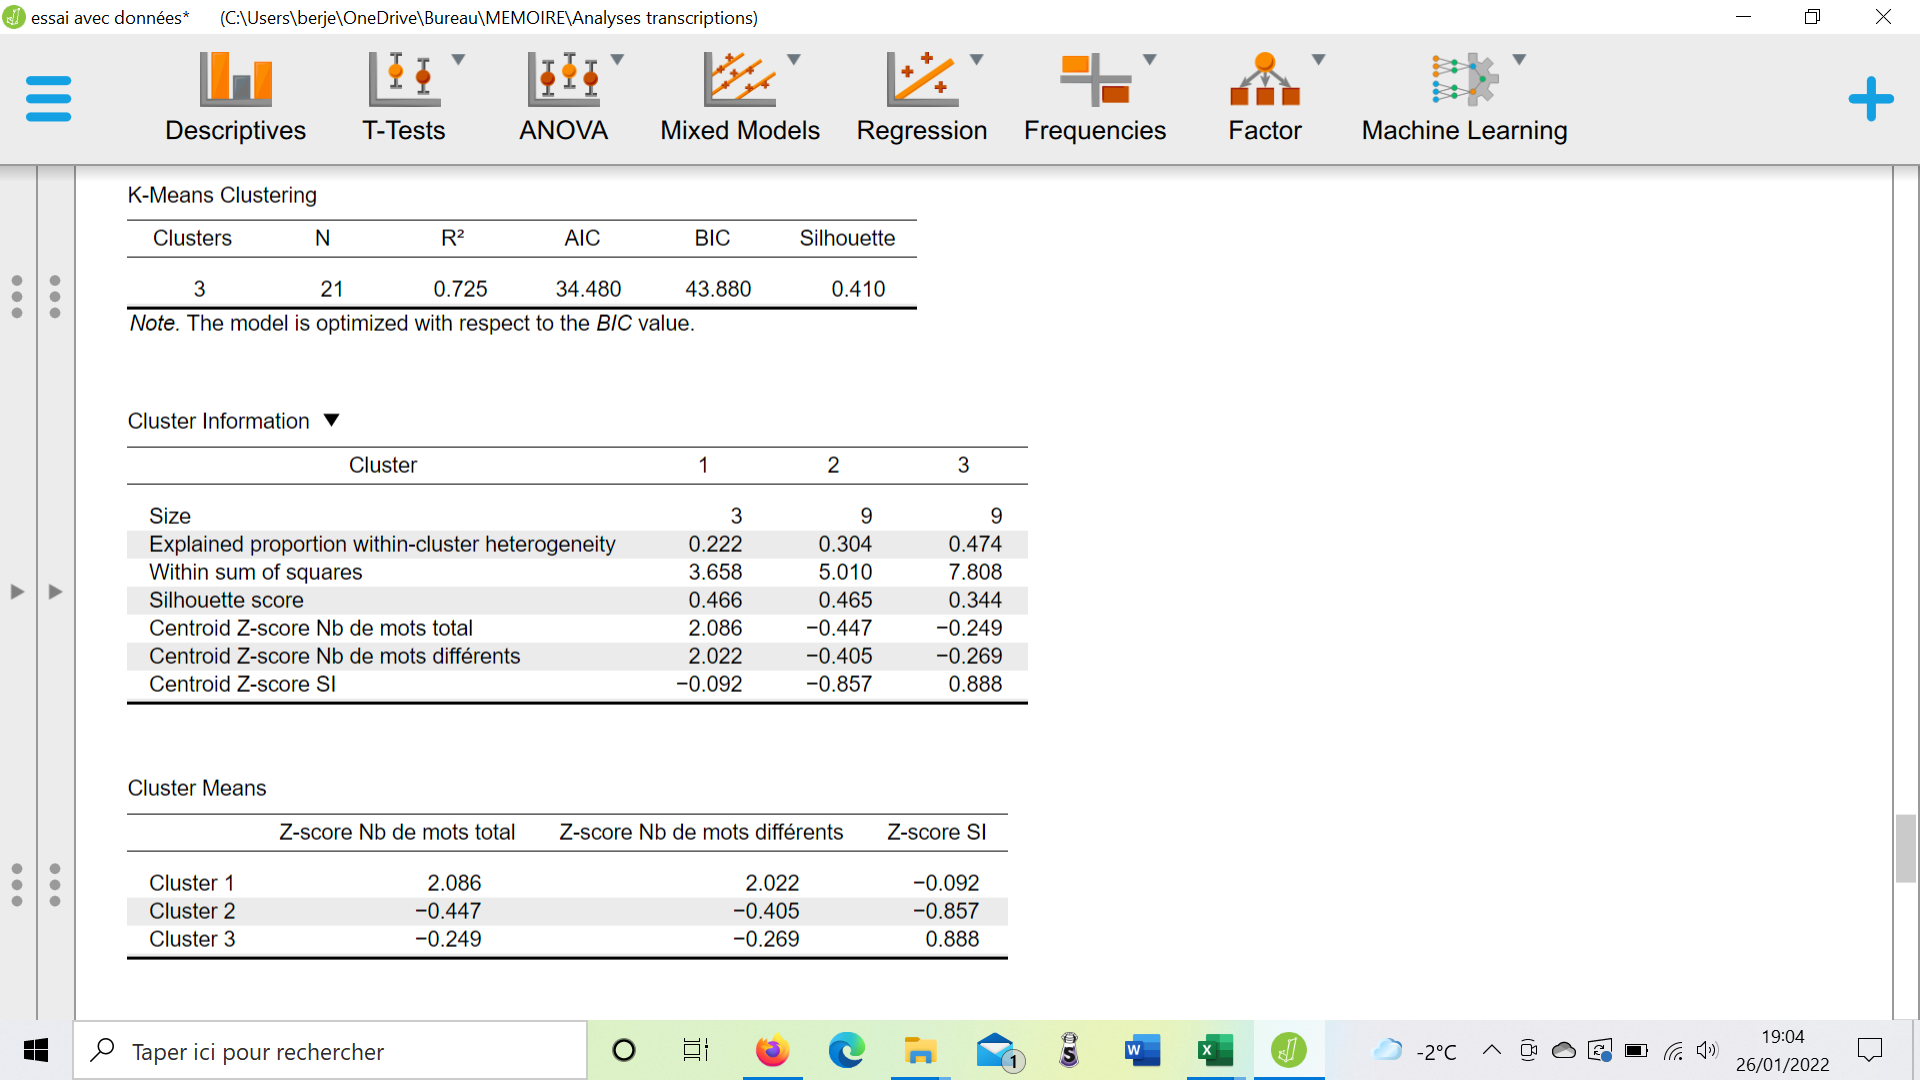
Below are results with Z-score
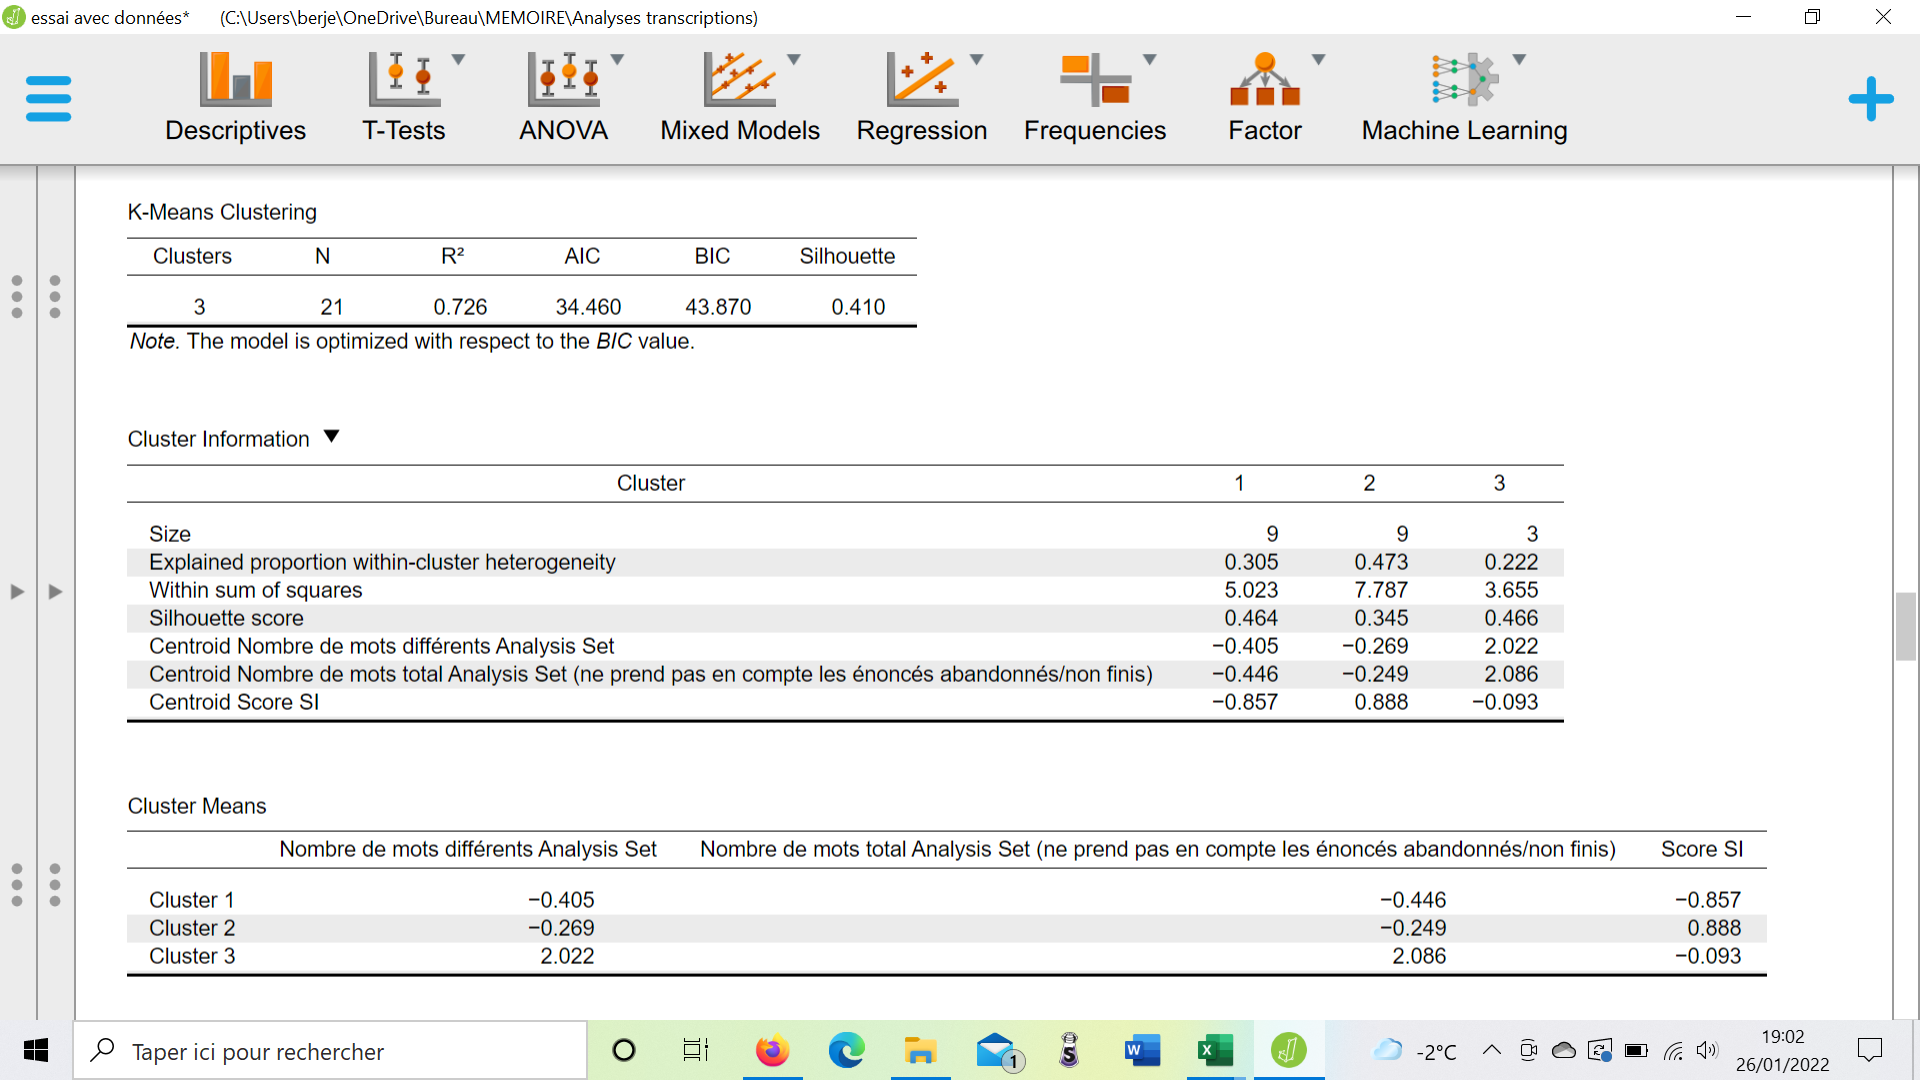
And below without Z-score
2-3- How do I add captions to my X and Y axes in "t-SNE Cluster plot" ?
2-4- How does "t-SNE Cluster plot" work when i input more than 2 variables ? (see pictures below, with 3 variables)
And with 3 variables, how are axes represented ? (is there more than 2 axes when there are more than 2 variables ?)
Any help would be greatly appreciated and I thank you in advance for your answers.
Manon
P.S : excuse my language since English isnt my native one.


Comments
Dear Manon,
Let me try to answer your questions!
1- Is there any easy-to-use guide about k-mean clustering with detailled informations (and maybe step-by-step procedure) ? I'm still struggling with the understanding of the software.
Currently there is no step-by-step guide to K-means clustering in JASP. However, we the algorithm is well-known and for example described in:
James, G., Witten, D., Hastie, T., & Tibshirani, R. (2013). An introduction to statistical learning (Vol. 112, p. 18). New York: springer.
so you could take a look at Chapter 13.2.1 and 14.3 of that book (freely available at https://hastie.su.domains/ISLR2/ISLRv2_website.pdf) for an introduction to the technical aspects.
Usually the goal of your clustering procedure is one of two. First, you may want to find which observations belong to a pre-specified number of clusters. To do this, you can set the option "Cluster Determination" under "Training parameters" to "Fixed" and fill in the desired number of clusters. Second, you may want to find the optimum (unknown) number of clusters in the data. To do this, you can set the option "Cluster Determination" under "Training parameters" to "Optimized according to" and fill in a maximum number of clusters to optimize over. Then, you can make a "Elbow method" plot to look at the optimization results. Finally, after interpreting the results you can add the cluster memberships to your data set by checking and filling in the option below. You can then use these cluster memberships in further analyses (e.g., to split your data in descriptives etc.).
2-1- More specifically on k-mean clustering : Do scales have to be changed, or does JASP automatically change scales ? Can I use different scales, or do I have to use only one (for exemple, do I only have to use a Z-score scale) ?
If you check the available options under "Training parameters", you will see an option to "Scale variables" at the bottom. This option is checked by default, which (from the help file available under the blue "i" button on top) ensures "that values of variables from different scales range into a specific similar scale. As a result, standardizing provides numerical stability, which improves the clustering output. JASP uses the Z-score standardization of a mean of 0 and a standard deviation of 1" . Hence, there is no need to apply a z-transformation yourself to the data before entering the analysis. You can check or uncheck this box according to your preferences. I would recommend leaving it checked if you want to interpret the clusters in terms of standardized values, but unchecked if you want to interpret the clusters in terms of the actual values in the data.
2-2- What kind of data do I have to input, between raw data and z-score, for k-mean clustering ? I tried both ways and dont get the same results.
This analysis always takes the raw data as input. See above.
2-3- How do I add captions to my X and Y axes in "t-SNE Cluster plot" ?
If you really want to you can click the black arrow next to the t-SNE plot in the output and select "Edit image".
Then you can click the checkbox "Show title" and fill in a title in the text box. The plot should adjust itself. However, this is not recommended for the t-SNE plot (even when you only have 2 variables) because the t-SNE algorithm applies a transformation to your data. Just look at this scatter plot of two variables:
And see what the t-SNE algorithm makes of it. See also the next answer.
2-4- How does "t-SNE Cluster plot" work when i input more than 2 variables ? (see pictures below, with 3 variables) And with 3 variables, how are axes represented ? (is there more than 2 axes when there are more than 2 variables ?)
The t-SNE plot is useful for visualizing high-dimensional data, but the downside is that the t-SNE procedure makes the axes uninterpretable. From the same help file: "t-SNE plots are used for visualizing high-dimensional data in a low-dimensional space of two dimensions aiming to illustrate the relative distances between data observations. The t-SNE two-dimensional space makes the axes uninterpretable. A t-SNE plot seeks to give an impression of the relative distances between observations and clusters. To recreate the same t-SNE plot across several clustering analyses you can set their seed to the same value, as the t-SNE algorithm uses random starting values".
So this plot can be useful to illustrate relative distances between your observations.
Best,
Koen