

Help for standard deviations K-means clustering

Hello,
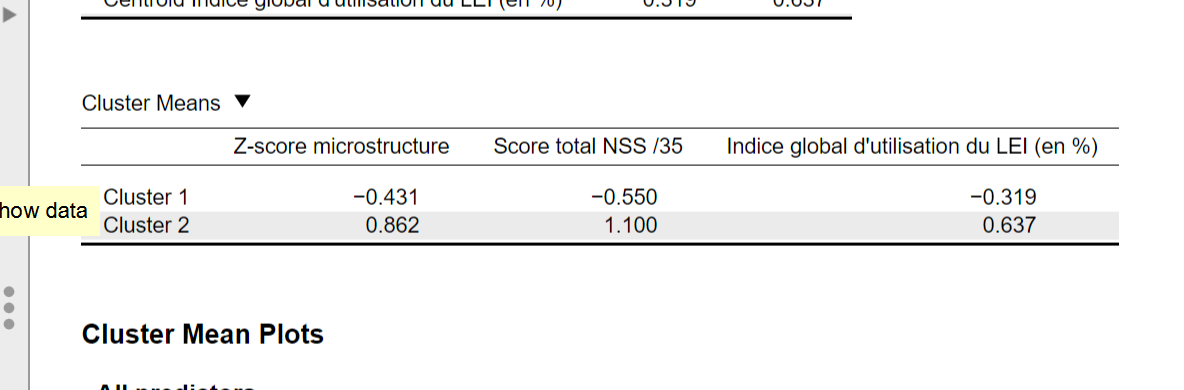
I would like to know if it is possible to show the standard deviations of the means we have when we do k-means clustering?
Indeed, for my work, would need to be able to access the standard deviations of these averages:
Is it possible to do it with the software? In any case I don't have the ability to calculate them by hand because I lack data.
With kind regards,
Thank you
Manon
Comments
Hi Manon,
This can be achieved by exporting the clusters to your data set by clicking “Add predictions to data” and filling in a name for the new column. Then, you can go to the descriptives analysis and use this new column to split the data (i.e., by dragging this variable to the “Split” box). Then, you should get the descriptives (mean, sd, etc.) for all clusters.
Koen
Hello,
it doesn't work. indeed I have done the instructions you gave me but it gives me only one table with one average while I have in my analysis three different clusters.
Moreover, I put my analysis in the variables and not in split because otherwise I have no results in the table...
I am attaching the examples in images
thank you
Hi Manon,
If the cluster memberships are in the variable "macro VS micro" then this variable should be dragged to the "Split" box. You should then insert all the variables you have used in your initial cluster analysis in the box under "Variables".
Say you have used the variables "A", "B", and "C" to find the clusters. You can then export these memberships to a new variable "Z". In the descriptives analysis you should then drag the variables "A", "B", and "C" to "Variables" and the variable "Z" to "Split".
Let me know if it works!
Hello,
Here are the results I get, it does not correspond to the results I have already noted...
I must admit that I'm starting to despair, the software that seemed simple to use is finally complicated, I don't find the same results each time, they are different depending on the table or the graphs, as well as the names of the clusters, I feel really lost and I feel like I can't move forward.... because I don't have an answer to all my questions asked on the forum.
Hi Manon,
Can you try the the following steps:
Hi!
After following your instructions, this is what I have, I'm sorry but it doesn't work... For the microstructure Z-score, I was forced to create this score because my microstructure score contains 3 different data with different scales, so I can't average the three to get a raw score. Moreover by checking "set seed", I have too many clusters...
Again, even with your directions, I can't find the same results in the tables.... and the graph doesn't even open :'(
Also, I would need to know which point corresponds to which participant, is that possible?
Thank you for your time,
Manon