

about error bar in JASP

Hi, I have a question bout the error bar ploted by JASP.
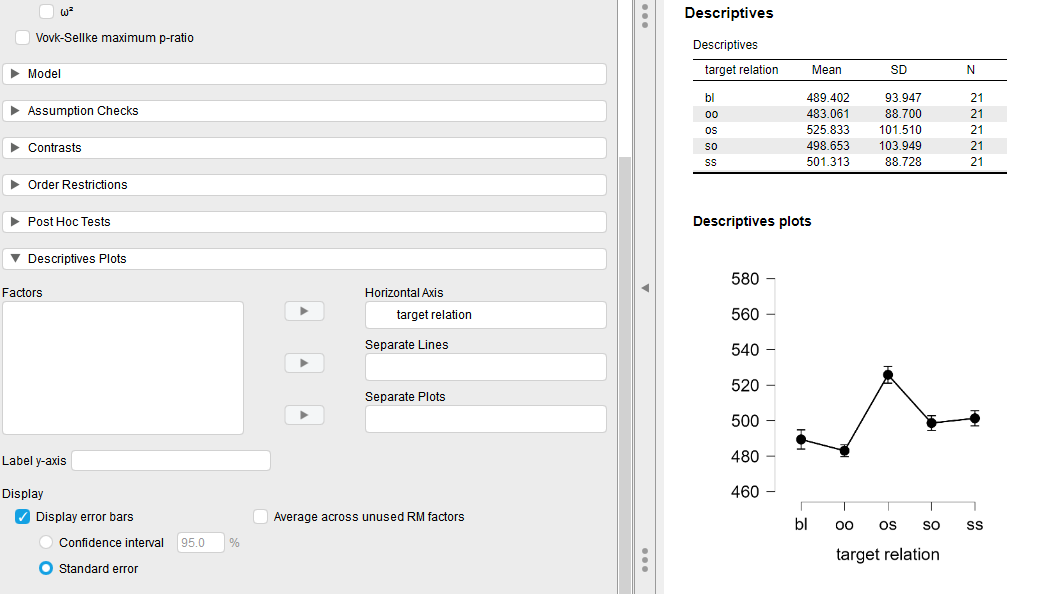
As showed in the figure above, let say the ‘bl’ condition, its SD is 93.9, so it SE should be about 20.5, but the error bar in the “discriptives plots” is very short, it may be only 5.
Why is this happening, Am I missing something?
Thank you!
Comments
Hi @tong ,
We apply a correction to these confidence intervals, based on Loftus & Masson (1994) and Morey (2008). This is what we write in the help file:
By selecting this option, error bars will be displayed in the plot. The error bars can either represent confidence intervals or standard errors. In order to get accurate confidence intervals and standard errors, the data are normalized by subtracting the appropriate participantʹs mean performance from each observation, and then adding the grand mean score to every observation. The variances of the resulting normalized values in each condition, and thus the size of the bars, no longer depend on the participant effects and are therefore a more accurate representation of the experimental manipulation. See Morey (2008) for a thorough discussion of this procedure.
So if you would use the normal, uncorrected version, the within-participant variation is conflating the effect of the manipulation (either over- or underestimated).
Kind regards,
Johnny
Thanks for your answer!@JohnnyB