

JASP 0.16.2: density line missing

JASP 0.16.2 on Mac, but same behaviour observed by multiple users on different platforms.
In distribution plots, enabling "Display density" does not seem to make any difference - y axis does not change, no line is shown. Is this expected?
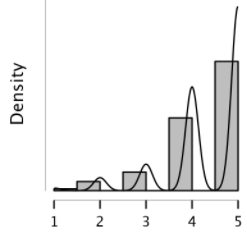
For correlation plot, density line is drawn, although I'm a bit puzzled whether it should look like this for integer values?
Comments
Strange, I'll take a look. This does seem more of a bug report for our GitHub page...
I've tried this, and ticking "display density" changes "counts" (with numbers on the y-axis) to "density" and adds a smooth line. If this does not work for you, can you please create an issue on our Git Hub page?
Thank you so much for the response. It did seem like a possible bug, but as a statistics and JASP noob I was not sure - reporting now :)
Created https://github.com/jasp-stats/jasp-issues/issues/1695 .
Terribly sorry in advance if this is me misunderstanding something.