

"Specify sequence" for forest plot X-axis fails to implement

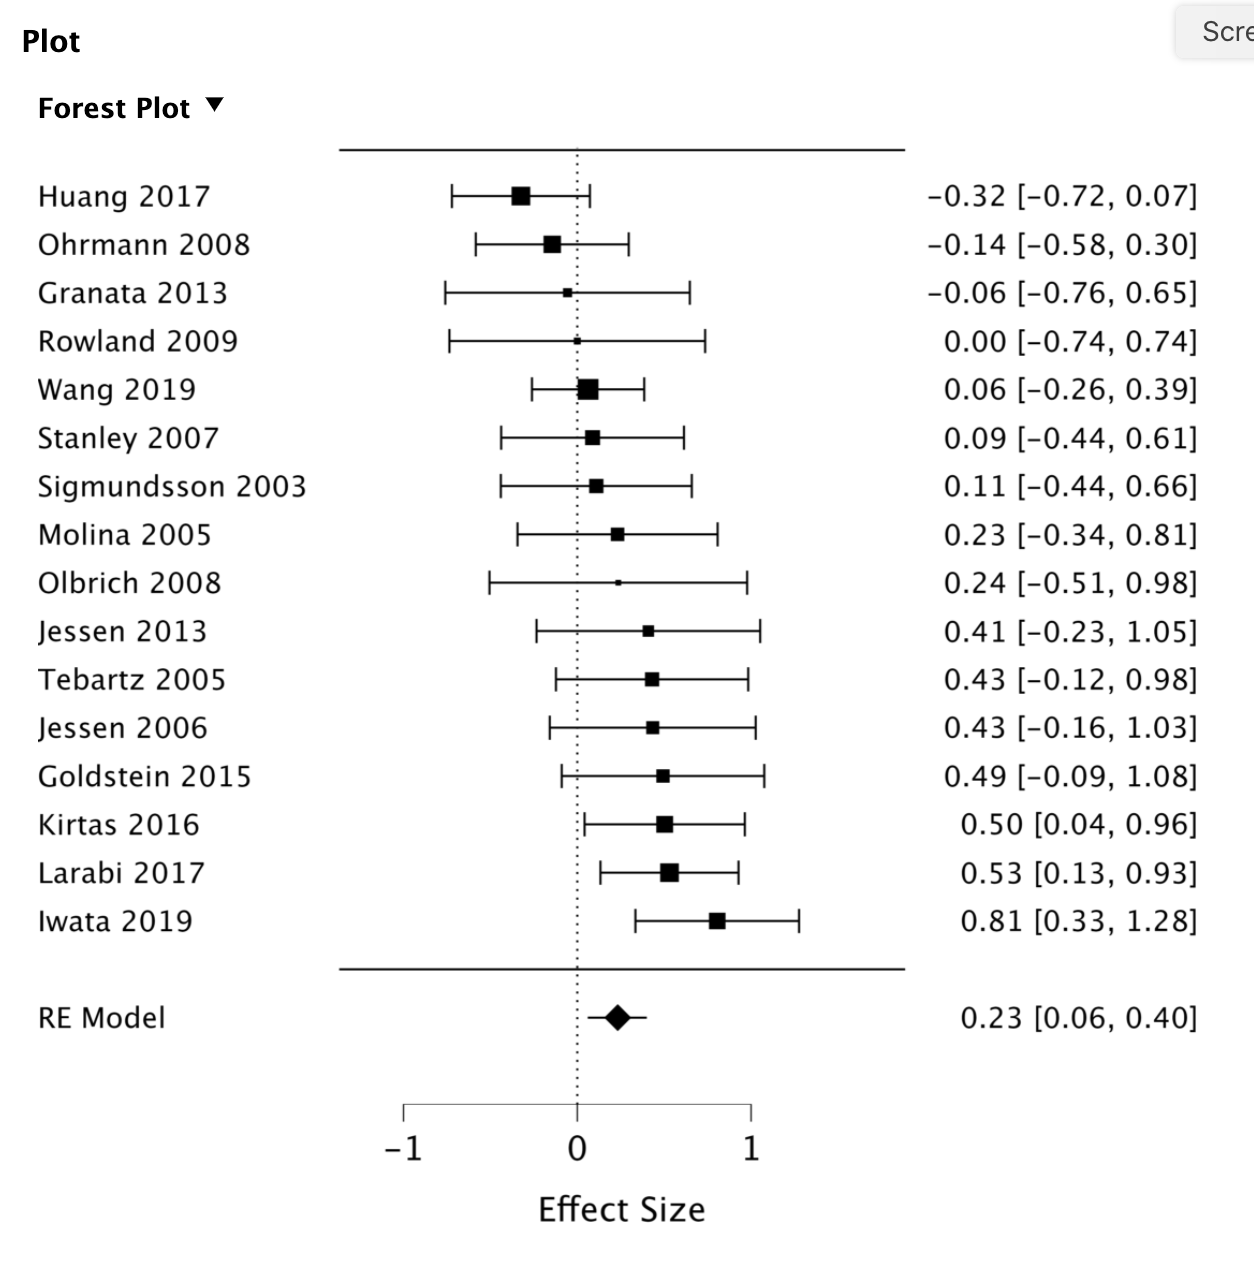
When reporting a series of 6 meta-analyses, I prefer to use the same range and scale for the pooled effect sizes displayed in the forest plots for all 6 meta-analyses. This gives the reader an intuitive sense of the relative strength of the different effects. By default, the range and scale of the pooled effect size on each forest plot X-axis defaults to reflect the range of effect sizes (and CIs) in the included studies. This is shown in the two images below. Here is forest plot #1:
Here is forest plot #2:
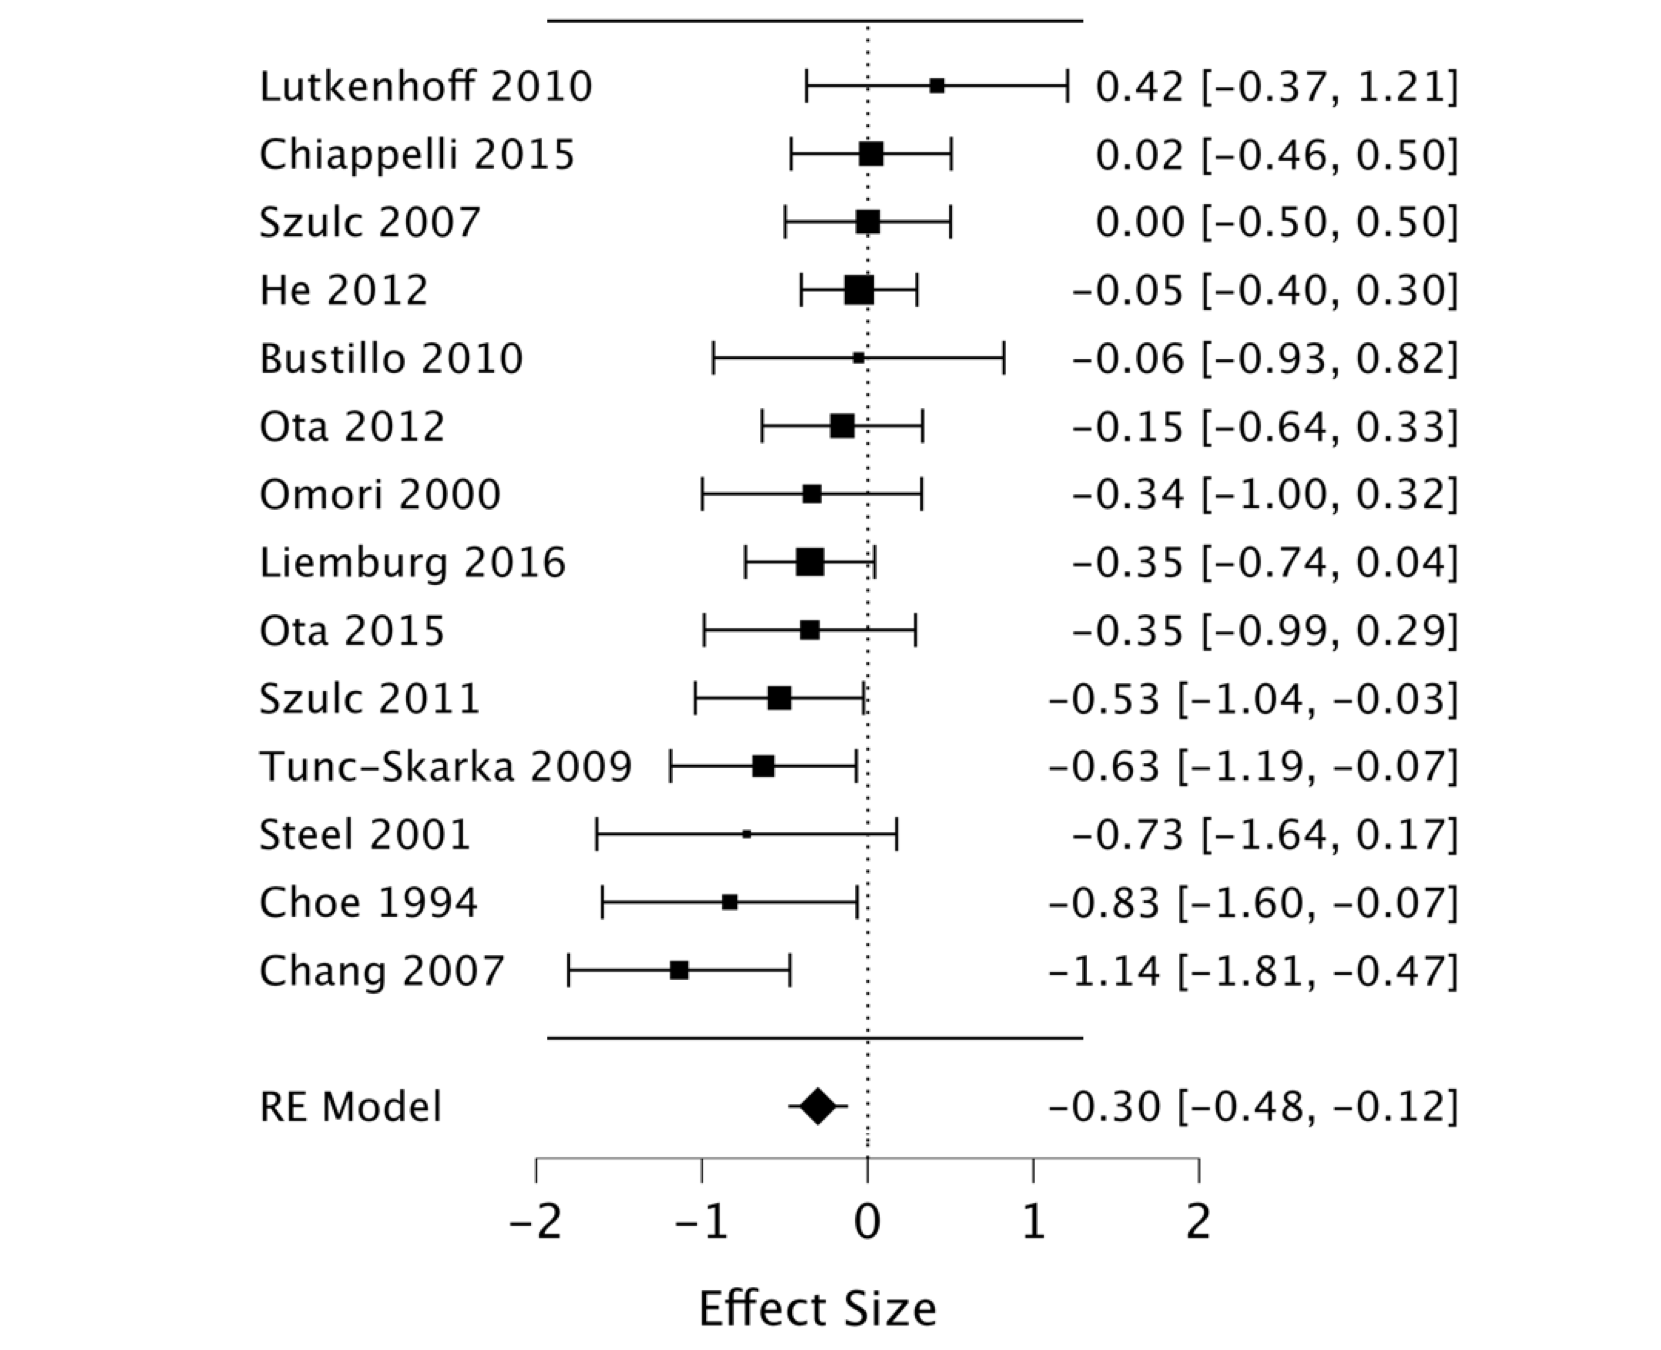
I want to change the range and scale of the "Effect Size" on the X-axis so that it runs from -2 to +2 for all forest plots in this publication.
There is an option to edit the image. This option includes a field that claims to allow me to "specify sequence", which should allow me to use the same range for the pooled effect size on each forest plot's X-axis. However, when I enter the range of "-2 to 2" in the appropriate fields, the graphic for forest plot #1 defaults back to its original range and scale. It accepts my edits in the "edit image" fields, but does not apply them to the image. Is this a bug or am I missing something?
Comments
I've passed this on to our expert on this topic