Binary Logistic Regression Performance Plot and ROC curve

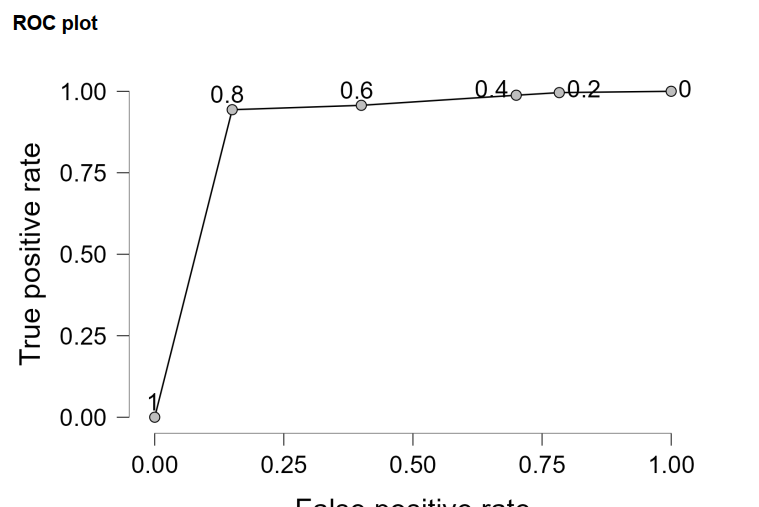
For binary logistic regression's performance plot and ROC curve, cut-off steps are may be added at various increments, .2 is the default. What do the .2 step values mean?

It looks like you're new here. If you want to get involved, click one of these buttons!

For binary logistic regression's performance plot and ROC curve, cut-off steps are may be added at various increments, .2 is the default. What do the .2 step values mean?
Comments
Dear @Mike_Szymczuk,
thank you for your question.
These cutoffs are based on the probability scale, so for instance 0.8 cut-off means that if a data point is predicted to have at least 80% probability of being in the "positive" category, it will be classified as "positive". By default, the analysis uses cut-off of 0.5.
I see that we lack documentation for this plot, I will see to add this explanation.