

RM ANOVA Confidence Intervals

Hi,
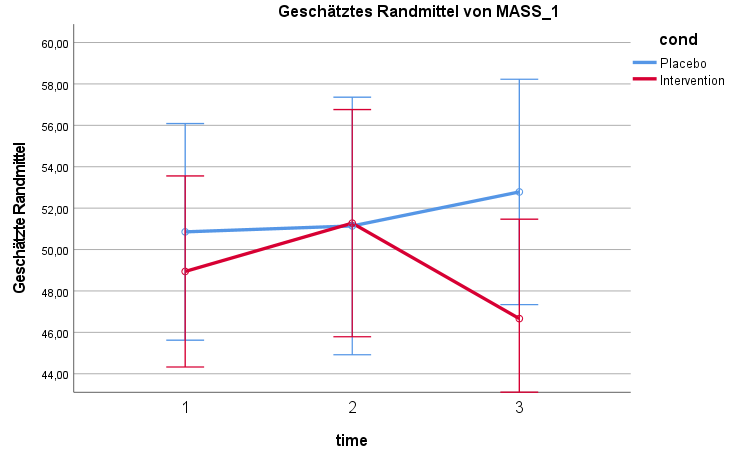
when calculating an RM ANOVA, I encountered a problem. Under "Descriptive Plots" you can set that confidence intervals are displayed. However, these confidence intervals do not match the confidence intervals that are output by SPSS. The confidence intervals in JASP are much smaller. I have attached screenshots of the JASP graph and SPSS graph. Both analyses are based on exactly the same data set. CI's were set to 95% in both cases.
What could be the reason for this?
Comments
For future reference: This is because JASP follows a special procedure for RM ANOVA plots:
Display error bars: By selecting this option, error bars will be displayed in the plot. The error bars can either represent confidence intervals or standard errors. In order to get accurate confidence intervals and standard errors, the data are normalized by subtracting the appropriate participantʹs mean performance from each observation, and then adding the grand mean score to every observation. The variances of the resulting normalized values in each condition, and thus the size of the bars, no longer depend on the participant effects and are therefore a more accurate representation of the experimental manipulation. See Morey (2008) for a thorough discussion of this procedure.We apply the procedure from Morey (2008), where some normalization is applied, so it is not as straightforward as sd / sqrt(n). See
Morey, R. D. (2008) Confidence Intervals from Normalized Data: A correction to Cousineau (2005). Tutorial in Quantatitative Methods for Psychology, 4(2), 61-64.
https://github.com/jasp-stats/jasp-issues/issues/2127
+1
I understand that in version 0.19, Morey's correction has been made optional (with the checkbox "normalize error bars"). However, even with this disabled, the CI bars still deviate from the SPSS graph; they even get a bit smaller and therefore deviate further. Both JASP graphs suggest a notable difference in T3 (no overlap in the CIs), while SPSS does not. I would expect the non-normalized graph from JASP to be identical to the SPSS graph, or am I wrong? What is going on here?
See the images below:
JASP normalized:
JASP not normalized:
SPSS:
I saw Johnny address this somewhere, but I forgot the location. I'll attend him to this issue.
EJ
Yes, just closed the issue today: https://github.com/jasp-stats/jasp-issues/issues/2127#event-14149289225
I now made the whole normalization optional, rather than only the Morey bit of the correction (which is also consistent with the option name "normalize error bars"). Hopefully it can still be included in the hot fix.