

Interpretation of H0 + Bayes Factor robustness check

Hello,
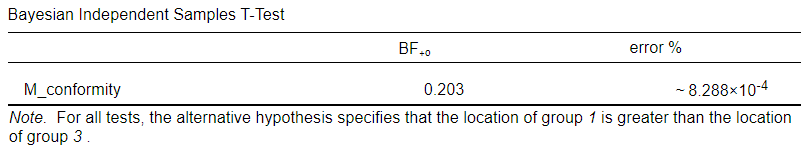
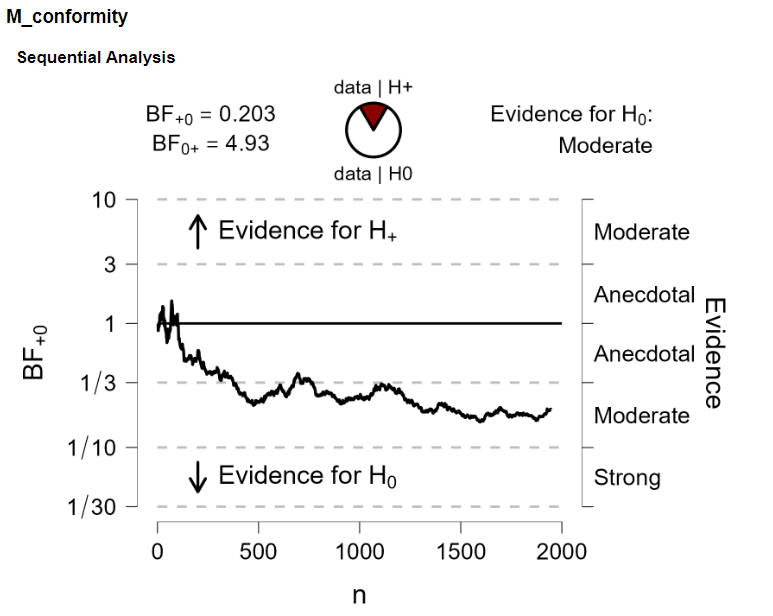
It's my first time interpreting a bayesian one-tailed two-sample T-test. If I understood correctly this outcome means that BF (0+)=4.93 indicates moderate evidence in support of H0. The data is 4.93 times more likely under H0 then under H1.
The alternative hypothesis states that people in group 1 show more conformity than people in group 3.
If the alternative hypothesis specifies that location of group 1 is greater than location of group 3, does it, in return, mean that there's moderate evidence that group 1 doesn't show more conformity than group 3? or does it mean that it's 4.93 times more like for group 1 not to show more conformity than group 3?
I don't know how to apply the data to the actual hypothesis.
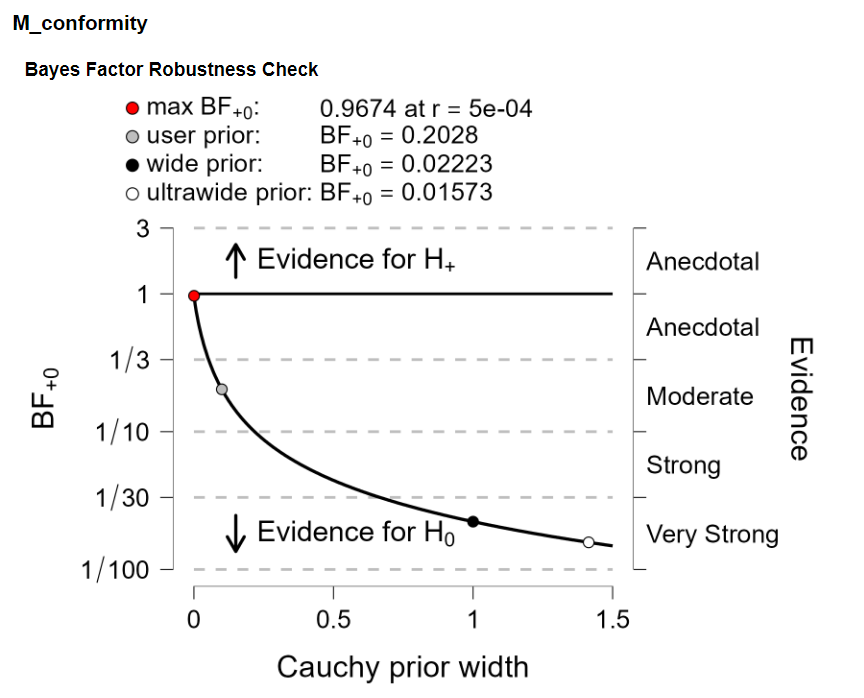
I also did the bayes Factor robustness check and I was wondering if this means that it is not robust due to the span. Is this correct and is there anything else I should extract from the robustness check?
What would be the next step knowing that it's not robust?
Thanks for your help!!!!
Comments
You've set a pretty narrow prior here, and nevertheless you have quite some evidence for H0. This suggests that the data show a pattern that is actually opposite the one predicted by H+. It may help to look at the descriptives (raincloud plot for instance).
Note that the robustness check will always give a BF=1 if the width = 0 (because then H+ is the same model as H0). So I would not call these results non-robust. I just suspect that the data go in the opposite direction (and of course you have to be really careful to specify the correct direction).
Also
"If the alternative hypothesis specifies that location of group 1 is greater than location of group 3, does it, in return, mean that there's moderate evidence that group 1 doesn't show more conformity than group 3?"
Correct. Well, there is evidence that group 1 does not show more conformity than group 3 (H0) **compared to** the hypothesis that group 1 does show more conformity than group 3 (H+). Evidence is always relative and involves at least two rival hypotheses.
"or does it mean that it's 4.93 times more like for group 1 not to show more conformity than group 3?"
I am not sure how to interpret that statement, but be careful not to confuse evidence with posterior probability (see https://www.bayesianspectacles.org/the-single-most-prevalent-misinterpretation-of-bayes-rule/)
E.J.