

Confidence intervals in descriptive plots

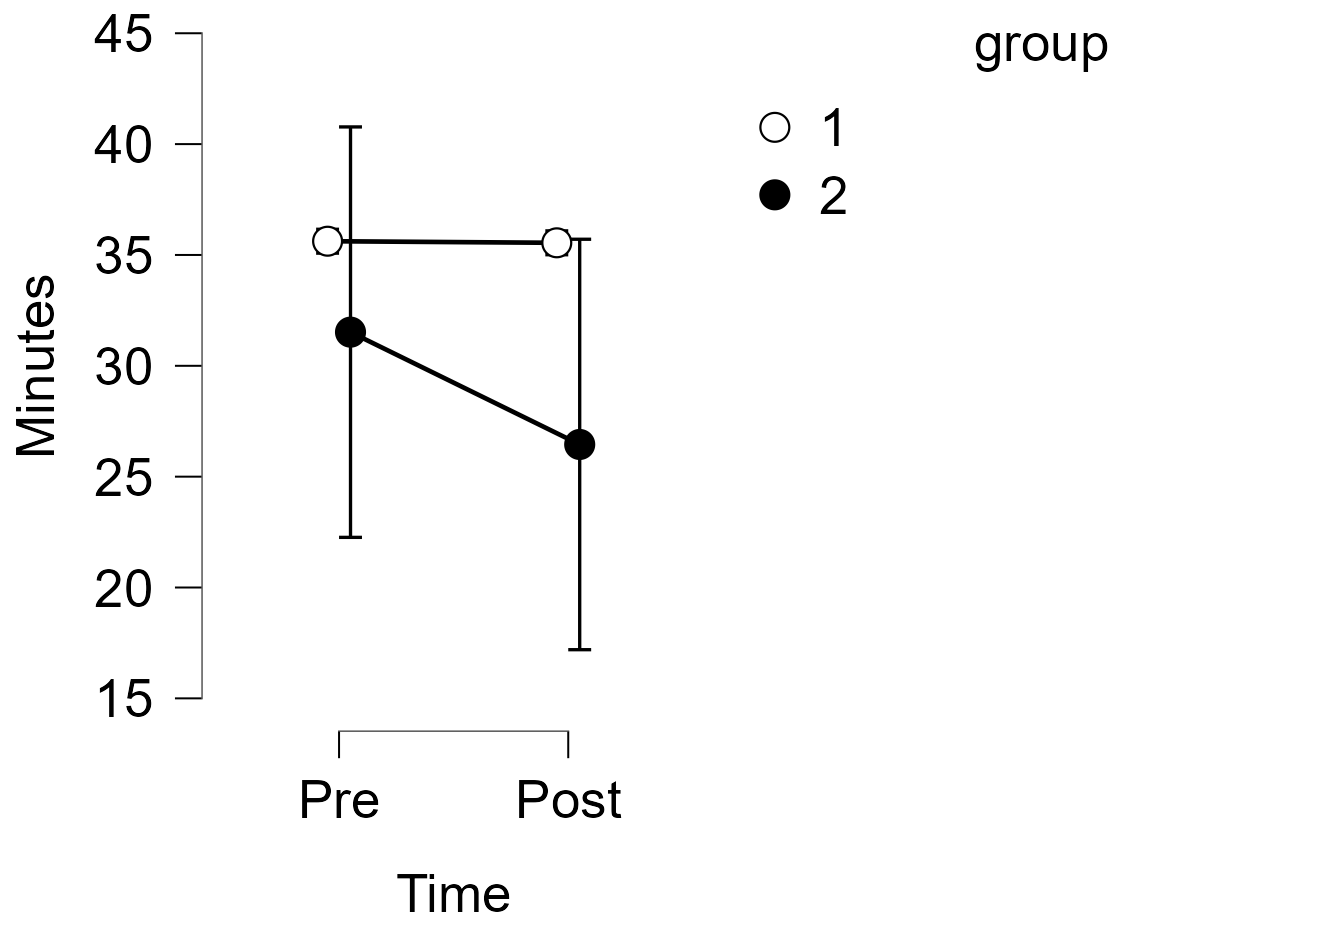
I cannot figure out why my plot for repeated measure ANOVA is only featuring the confidence interval on one plot group. It appears it is combining all data and plotting it on a single group. If I separate the plots (two graphs), I get the CI for both groups, but one still appears to be very high. Any insights?
Comments
If you look carefully, you'll see that there are indeed confidence-interval error-bars around the Group 1 means. They're just very narrow intervals. My guess is that they're narrow compared to Group 2 because the sample size is much larger in Group 1.
R