

Anova Test Result Analysis

Hello All,
I am new to statistics and JASP. I need to provide answers to two research questions.
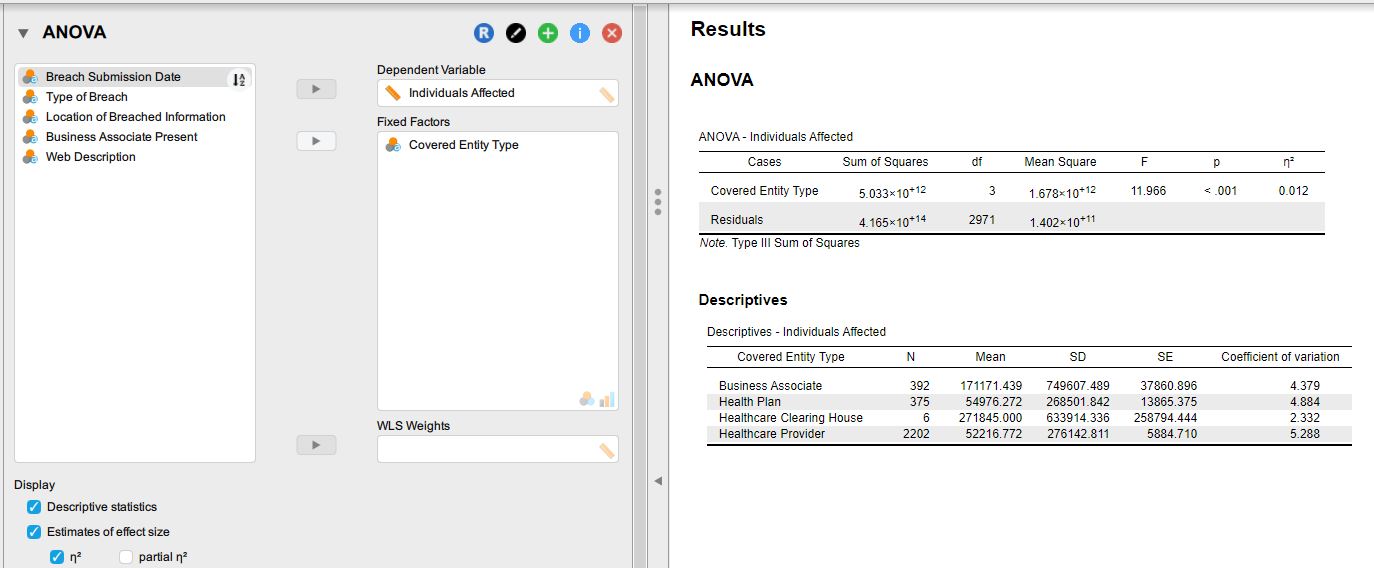
RQ 1. To what extent did the number of Individuals impacted by a data breach relate to the healthcare entity type?
H01. p greater than 0.5, the test is not significant, fails to reject null
Ha1. p is less than 0.5, the Test is significant, Reject my null
I am not sure if I have chosen the correct statistical test. Although the p value shows <.001, which means the test is significant but I don't know how to interpret or translate the result.
Thank you in advance for your help.
Comments
Hello,
I think we would need a bit more information to understand whether you used the appropriate analysis and how to interpret the results. For instance, it seems that your dependent variable is "the number of individuals impacted by a data breach" and the independent variable is "the healthcare entity type". This sounds to me like a chi-square test analysis (frequency counts by groups). However, in your descriptives you have a mean for each group, what does that mean represent? Is it the number of people affected? If so, why is it different from the sample size?
Also, double-check if you wrote down the alpha level correctly. It seems like a typo (i.e., 0.05 vs 0.5).
Best,
Alejandro.
I am sorry, Alejandro, for the late response. I did not receive a notification that a comment had been added, or I may have accidentally deleted the notification.
Yes, let me explain. I have one dependent and independent variable: The data breach type is an independent variable with five groups. The number of individual records impacted is a dependent variable.
I also have another independent variable named Healthcare Entity. These two independent variables will be used to answer the research questions and hypotheses.
I want to know if the number of record breaches relates to the data breach type or if it only happens by chance. Also, want to know if the number of record breaches relates to the Healthcare entity type.
RQ 1. To what extent did the number of Individuals impacted by a data breach related to the healthcare entity type?
Hypotheses
H01. The type of healthcare entity type and the number of individual records compromised is by
chance and not related.
Ha1. The type of healthcare entity type and the number of individual records compromised is related and not by chance.
RQ 2. To what extent did the number of Individuals impacted by a data breach relate to the data breach type?
Hypotheses
H02. The data breach type and the number of compromised individual records are by chance and not related.
Ha2. The data breach type and the number of individual records compromised are not by chance and are related:
Please help. I think I have chosen the wrong statistical test. Please see the attached csv file. Please let me know if you need additional information.
Hi Alejandro, to add to my earlier comment. The attached CSV file is the whole population. But I would like to select a sample from the population. My dilemma is that I don't know how to determine the sample size using a G power or similar tool. I appreciate your help.
I have determined the sample size, which is 540 randomly selected.
Please help me check if the analysis is correct and whether the result answers the research question/hypotheses correctly or not based on the p-value.
Hi,
Sorry for the late response; I don't get notifications either.
After checking your database, it seems that ANOVA might not be the most appropriate for testing your hypotheses because your data are highly skewed (you can check it out with the Descriptive Statistics module as shown below; make sure to check the "Distribution plots" box).
You can also check the boxplots that show how your data is distributed.
I'm unfamiliar with this kind of analysis, but I would suggest reporting how often the breach occurred (times by entity type and type of breach) with a crosstable. Make sure to check the column percentages option in the "Cells" sub-section.
With that table, you could determine what covered entity type had the most data breach events (not the number of affected people), what type of data breach was most common, and what data breach was most common per covered entity. You can test that hypothesis using chi-square. However, there are some zeros in that table, so the result might not be reliable. You can filter out the healthcare clearing house because this group has the lowest number of events (n = 6). That would help to maintain the chi-square result reliable.
Regarding the number of people affected, you have a time entry with the number of affected people by date. Maybe you should use a time series analysis for this variable; however, I'm not familiar with that kind of analysis (perhaps someone more experienced can help), but it sounds to me like that should be a variable to consider after quickly checking how your data behave (see graphs below).
Hope it helps,
Alejandro.
If you really have the "whole population," such that you're not trying treat the data you have as a random sample, and not trying to draw inferences about a larger set (a population), then descriptive statistics (means, medians, totals, etc.) are all you need ad all you should be seeking. (The only reason to do an inferential analysis like an ANOVA or Chi Square test is to infer population characteristics from samples.)
R
Thank you for your response. The reason why I have to use ANOVA is because I need to test the hypotheses, and hence, I cannot use the entire population. I believe I have the correct sample sizes that were randomly selected. For the data breach independent variable, which has five groups (N=5), the sample size = 305. The covered entity type has three groups (N=3), and the sample population is 252. Alejandro was right about the clearing house; I removed the clearing house to avoid the result being skewed.
I have attached the CSV file; I would appreciate it if you could run the test and provide feedback. Thank you for all your help.
The only reason to use a sample is as a means to infer characteristics of a population that cannot be examined directly. But you've indicated that you have the whole population. If that's the case, conducting any kind of significance test on a subset of the population won't tell you anything you don't already know.
R
Thanks again Andersony3k. In order to answer the research question and hypotheses. To my limited knowledge, ANOVA is the preferred option. I just wanted a second opinion to validate my result for accuracy.
Ok. In my judgment, it's not the preferred option.
R
I appreciate your feedback Andersony3k. Please tell me what statistical analysis would be used to answer the questions below. I have attached the population size.
Thank you for your time. I appreciate it.
Typically, the phrase "are by chance" is presumed to mean "are due to random sampling error, such that o relationship would be present of the entire population were examined."
It's hard for me to understand how you could possess the entire population of data breaches that might have occurred. If you want to apply a statistical model such as a t test or ANOVA that presumes you're dealing with a random sample (or set of random samples), then you need to be able to conceptualize your data as being an approximately random sample of all of the values you might have obtained--i.e., a random sample of all of the data breaches and data-breach-impacts that might have occurred. If you do that, you can validly use ANOVA to analyze your data.
Alternatively, it would be unusual to ask the "are by chance" question about data that constitute all of the potential observations and thus could not possibly be impacted by random sampling error. There is a rather advanced technique called "permutation testing" in which you can take a not-uncontroversial approach to analyzing whole-population. Specifically, you could presume that you have the whole population of all compromised PHI records that could have been generated, but you have just a sample of all the ways in which those instances could have been matched up to breach types. Because it is advanced, I would not recommend this approach. Instead, I would recommend the ANOVA approach in which you treat all the data you have as a random (or approximately random) sample of data, drawn from a population.
R
that is exactly what I did. After determining the right sample size using G * power, I used a random function in Excel to select the sample size from the population.
No. That's not at all what I'm saying the entire set of data that you have needs to be considered a sample and not a population. It is not meaningful or appropriate to then take a smaller random sample from what is already conceptualized as a random sample.
R
Here is what happened when I used the population as a sample. The issue I have with this approach is that it will not answer the research questions and hypotheses. Your thoughts are appreciated.
I think the problem is that your statistical hypotheses use a rather loose shorthand language and are not properly formulated within the framework of classical or even some more modern forms of statistical analysis.
Technically speaking, statistical hypothesis (i.e., H0 or Ha) are about populations, not about samples. The (random) samples are simply a means to test the hypotheses. For example, in your situation H01 should be "The number of compromised PHI records is equal across the five *populations* of breach types."
The reason it's just a hypothesis and not known fact is that one does not have direct access to the populations. Instead, one uses samples to draw an inference abut the populations. Specifically, the samples are used to answer the question, "If the null hypotheses were true, for the populations, what the probability that I would find a pattern in my sample that's at least as extreme as what I actually found?" (That's what we call the p value.) Clearly two things must hold in order for this kind of testing to make any sense:
(1) You cannot already have direct knowledge about the number of compromised PHI records in the five *populations* of breach types, because then you would already have the answer to any numerical question you might have about the population. You would not need to use hypothesis testing to infer such answers.
(2) Instead of having the population data, you need to have a sample that will then allow you to infer (with some chance of error) characteristics of the population(s).
So you need to either treat all the data you have as a population, in which case it makes absolutely no sense to try to use ANOVA or any other method to infer what you don't need to infer about the population because you already know it, or you need to treat al the data you have as sample taken from a population of potential observations (i.e., the set of beaches than theoretically could have happened).
To reiterate, I think the problem is that your statistical hypotheses have used rather loose shorthand language, ad have not properly formulated within a standard framework for conducting inferential statistical analysis.
R
Thank you for your explanation. Assuming I want to drop the hypotheses and answer the main two research questions. What would be the best statistical analysis using the whole population as a sample? Thanks again.
This was is still not clear to me since your whole data set is either a population or a sample, not both. If you want to treat your whole data set as a sample, then you would conduct the ANOVA on the entire set of data that you have. I see no reason to only analyze a random sample from your data set.
R
Let me explain a bit more about the population. The total number of data breach occurrences is 2969 and is regarded as the population spread across three different entity types and five breach vector types. The dependent variable is the number of PHI records impacted by each breach event. The independent variables are the data breach type and the entity type. Using the entire 2969 occurrences as a sample would be too large and may not answer the hypotheses. Thank you.
Hi. I can only reiterate what I've already indicated above:
(1) I don't agree that "The total number of data breach occurrences is 2969 and is regarded as the population . . ." Rather, I believe it is the researcher's choice as to whether to take it as population or a sample.
(2) *If* it's possible that there could be future breach occurrences across the three different entity types and five breach vector types, beyond the 2969 that have already occurred, and *if* the researcher wants to reach a statistical conclusion about the distribution of such occurrences *generally*--that is, including all future occurrences--then the researcher is definitely treating the 2969 as a sample and not as a population. In that situation, an a ANOVA on all 2969 occurrences is appropriate. (Also, 2969 is not too large of a sample; a sample can never be "too large.")
(3) On the other hand, if there's NO possibility of any future breach occurrences across the three different entity types and five breach vector types, and consequently no intent that the analysis be relevant to any such future breaches, then the research is definitely treating the 2969 occurrences as a population--to be described using means, standard deviations, medians, percentiles, etc. ANOVA, t tests, general linear models and the like, are *not descriptive* (instead they're inferential in that they use samples to *infer* infer population characteristics) and are therefore useless in "analyzing" an entire population.
R
Thank you for the analysis. If I go with using 2969 as my sample size and using ANOVA, the p-value for both the covered entity type and the data breach type is less than .05 (.001 ), but the post hoc test shows different p values when comparing the mean of the groups. The conclusion that can be drawn from the analysis is that the test is significant. The number of impacted PHI record breaches is the same, independent of the entity type or the data breach type vector. With this approach, I will not include any of the hypotheses. Please let me know if my interpretation of the result is appropriate or correct. I truly value your contribution and your time.
If you were to do an ANOVA with 'Number of Individuals Affected' as the dependent variable, with two factors consisting of 'Type of Breach' (5 levels) and 'Covered Entity Type' (3 levels), you would need at least two observations within each of the 15 cells. However, you have a couple of cells with either 1 or zero observations.
I combined the two least frequent breach types and ran the ANOVA: The 'Number of Individuals Affected' is the dependent variable, and there are two factors consisting of 'Type of Breach' (4 levels) and 'Covered Entity Type' (3 levels). (I tried to post the analysis as an attachment, but it's a little to large).
There is a significant main effect of 'Type of Breach.' Thus, the data pattern in the sample of 2969 observations supports rejection of the null hypothesis of equal population means (across the four Type of Breach).
There was no significant main effect of 'Covered Entity Type,' and no significant interaction.
A couple of complications are that your data violate the ANOVA's equal variance assumption and appear to violate the normality assumption. To reduce the severity of the violations, you might consider identifying and deleting any outliers.
R
Thank you for all your comments and help. After cleaning the sample data and removing the smaller data breach types, I now have 2920 samples. The number of Individuals affected is the dependent variable with two independent variables, 'Type of Breach' (consisting of 2 levels/categories) and the independent variable 'Covered Entity Type' (3 levels/categories). I have attached the analysis output and the CSV file. Please let me know if ANOVA is still appropriate, and I apologize for any repetitions. I welcome your opinions and feedback.
Hi. For a beginner, I think the ANOVA you've done is good enough, acknowledging that you have pretty substantial violation of equal variance and of normality.
A more advanced analyst would attempt to reduce the severity of the violations--perhaps by transforming the dependent variable. I included an ANOVA that uses the log transform: XBreach_DataSet_2019-2023.zip . This seems to have helped some. Others have recommended using more sophisticated transformations, which may involve using a 'Generalized Linear Model' rather than ANOVA. See https://sciences.ucf.edu/biology/d4lab/wp-content/uploads/sites/23/2017/01/OHaraKotze2010.pdf
R
Thanks a lot for your feedback and the analysis. I have opened the attached zip file. The output is quite detailed. The first output of your analysis looks similar to mine. Great to learn that the correct statistical test (ANOVA) is being used. Two hypotheses are being tested: (1)whether the number of impacted individuals relates to the breach type, and (2) whether the number of impacted individuals relates to the covered entity type. It would be great to hear that the analysis provides the answers. I am trying to understand what can be inferred from the analysis and the conclusion that can be drawn. The p-value for both the data breach type and the covered entity type shows that the test is significant and has to Reject the null hypotheses. Thank you for your time and assistance. Greatly appreciated.
To reduce the substantial violations of ANOVA assumptions, I have normalized the data, and the resulting output shows that the p-value is greater than .05. Thank you for pointing out the violations. Hopefully, the output is accurate and acceptable :) Greatly appreciated.
In what sense are the data "normalized"? The QQ plot and the distribution plots show wildly non-normal data. I also don't know what you mean by "the p-value is greater than .05." There are three p values--only two of which are greater than .05.
R
Thank you, it is true, there were one p-values less than 0.05 out of the three p-values. I forgot there were two leading zeros 0.006. The Post Hoc analysis shows that overall, there were no significant interactions between the dependent variable and the two independent variables with the exceptions of two instances where two p-values were less than .05, I may be wrong. I used the word normalized because it is least option that I have to try and reduce the violations of normality and equal variance, again, I am not an expert of this, I am just trying to answer the research questions and the hypotheses. Once more, thank you for your continuous guidance and expert opinion. Much appreciated.
There was a significant main effect of 'Type of Breach' on the mean number of affected individuals ( p = .006).
Logically, it's possible that there could have been a significant interaction. In other words, it could have been the case that the change the mean number of affected individuals, as a function of Type of Breach, differed significantly according to Covered Entity Type. The place to look to see whether that significant interaction occurred is in the ANOVA table on the row where it says, "Covered Entity Type * Breach Type." The interaction was not significant (p = .973).
While the post hoc tests could help to clarify the nature of a significant interaction (if there were one), the post-hocs cannot themselves establish whether there is or isn't a significant interaction.
R