

95% Credible Intervals not consistent between descriptive and plot

Hello everyone,
I have performed a Bayesian RM ANOVA in the new version of JASP (0.18.1) and would like to obtain the exact value of the 95% credibility interval.
On requesting the table, I noticed that the descriptive table of 95% credible intervals did not match the values in the associated descriptive graphs below (see screenshot).
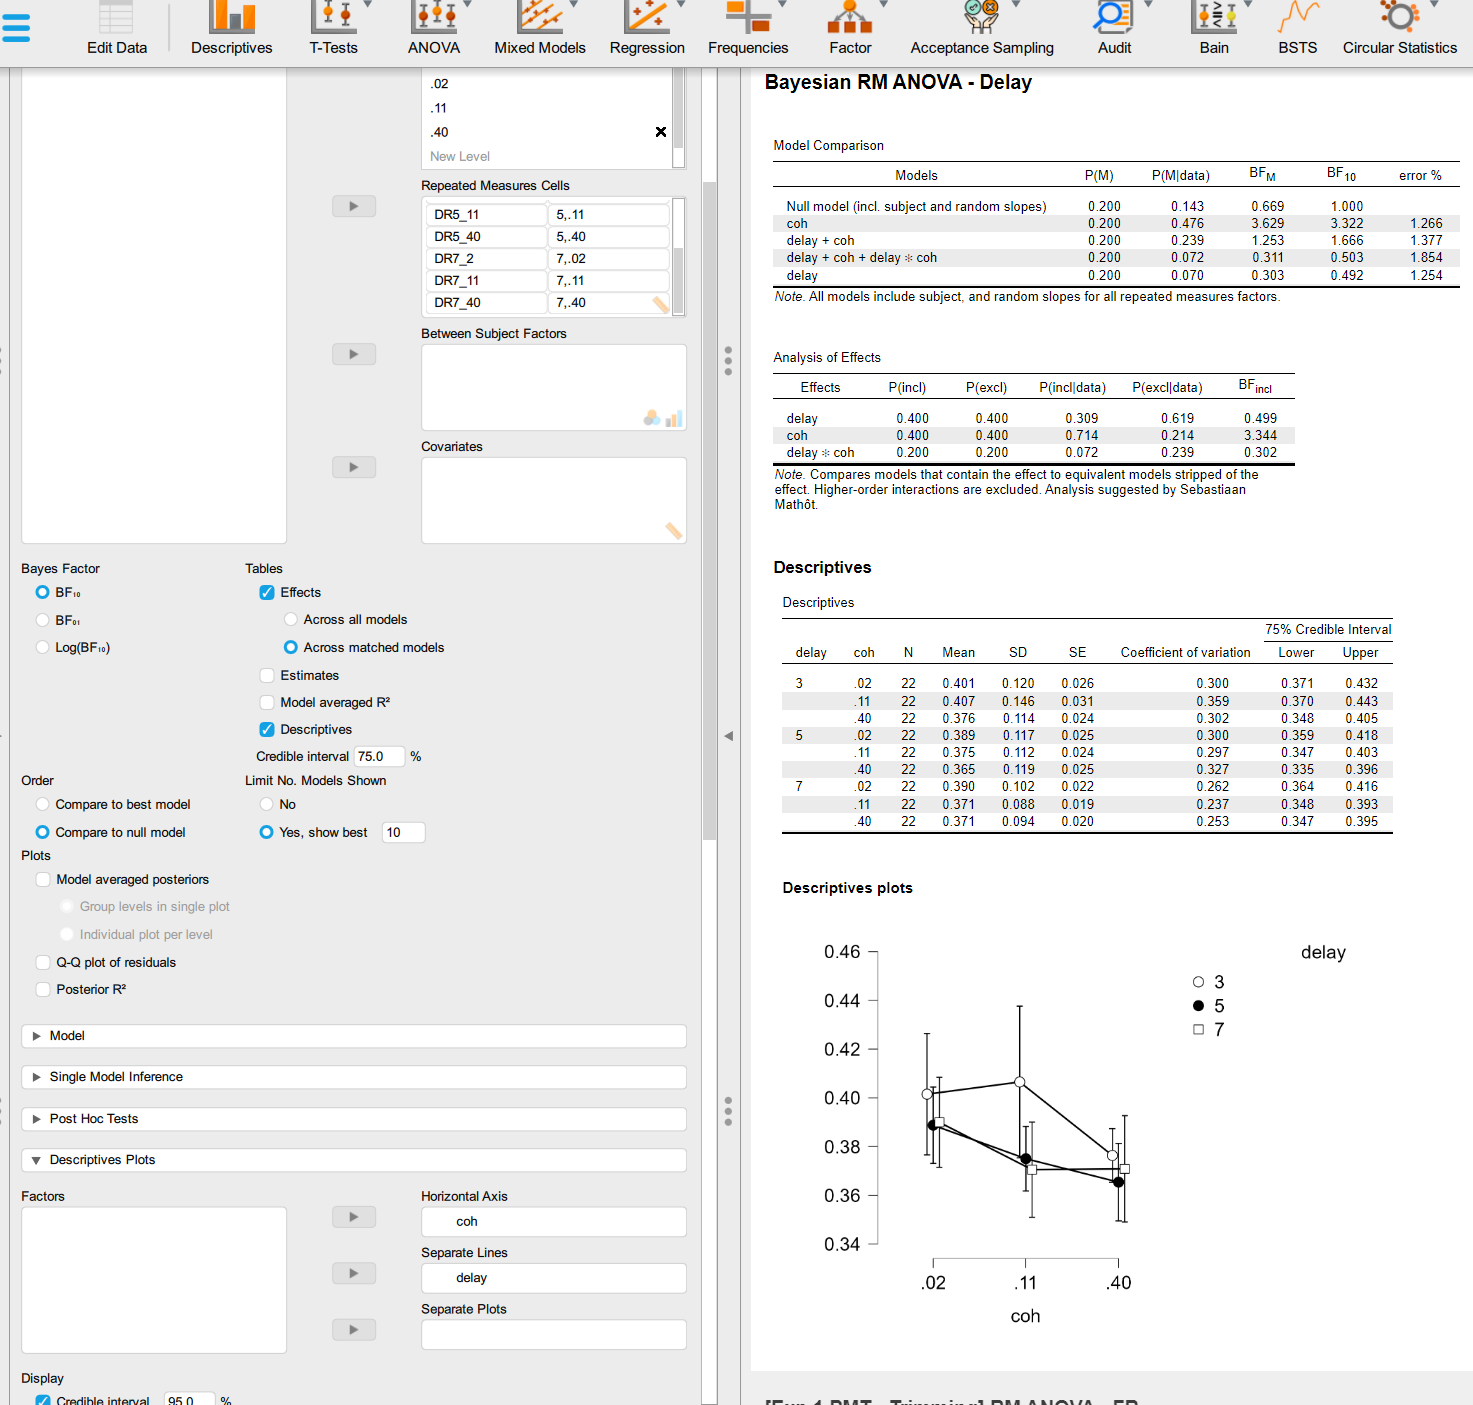
Is this a bug for these values or are these "credible intervals" quite different? If so, how are they calculated, and from which R packages? Also, what is/should be the correct credible interval (table or graph)?
Thanks for your help and answers, it's always very instructive to get your feedback!
Johan
Johan A. ACHARD
ATER - PhD student in Cognitive Sciences
Université Marie et Louis Pasteur, INSERM, UMR 1322 LINC, F-25000 Besançon, France.
Comments
An other example with one repeated measures factors :
It seem that descriptive plot display the 75% credible intervals :
What do you think?
Johan A. ACHARD
ATER - PhD student in Cognitive Sciences
Université Marie et Louis Pasteur, INSERM, UMR 1322 LINC, F-25000 Besançon, France.
I am confused now! I will tag some team members, but I was wondering what the issue was. Clearly the intervals will be different when one is a 75% interval and the other a 95% interval. Is the issue that the plot is nevertheless consistent with the table?
E.J.
Update: I do spot some mismatch between the tables and the figures when I set both intervals to 95%. I believe (because it is descriptives) that the intervals ought to be the same as the frequentist ones. So it is strange to see a difference. I'll ask the team.
EJ
Thanks for your answer. Do you find a solution about this problem? I am interesting by this subject to report this interval.
So if I understand the intervals are similars in frequentist and bayesian?
Johan
Johan A. ACHARD
ATER - PhD student in Cognitive Sciences
Université Marie et Louis Pasteur, INSERM, UMR 1322 LINC, F-25000 Besançon, France.
Hello,
Have you solve the difference in table and credible interval for Bayesian ANOVA ?
Or is there a solution to obtain the value of 95 credible intervals ?
Thanks
Johan
Johan A. ACHARD
ATER - PhD student in Cognitive Sciences
Université Marie et Louis Pasteur, INSERM, UMR 1322 LINC, F-25000 Besançon, France.
Hi Johan,
Sorry for the tardy reply, I looked into what was going on here, but promptly forgot to leave a message.
The CIs in the plots account for differences in within and between factors. The descriptives table, however, does not take this into account and essentially ignores the within/ between differences. So at the moment, it's more appropriate to look at the plot for the descriptives CIs.
I'll see to it that this discrepancy is resolved for the next release (unfortunately, there is too little time to fix it for the upcoming one, but it should be in the one after that).
Cheers,
Don
Hello,
Thank you for your time and your explanations.
I'm going to follow your recommendations until the next update.
Cheers,
Johan
Johan A. ACHARD
ATER - PhD student in Cognitive Sciences
Université Marie et Louis Pasteur, INSERM, UMR 1322 LINC, F-25000 Besançon, France.
Hi team,
I am running a Bayesian repeated-measures ANOVA with one factor.
I noticed new discrepancies between the 95% credible intervals in the Descriptive Table and the Descriptive Plot, as reported previously.
From the current version of JASP, is there a way to extract these values to report and/or plot them manually?
If not, I’d like to replicate in R. How to fit the equivalent model within the brms package and extract the correct 95% credible intervals for each condition?
Thanks for all.
Best,
Johan
Johan A. ACHARD
ATER - PhD student in Cognitive Sciences
Université Marie et Louis Pasteur, INSERM, UMR 1322 LINC, F-25000 Besançon, France.