

mt_import_long() issue

My trajectory data contain only 3 columns, with respectively time, x coord and y coord.
As mt_import_long() requires also an ID column, I have added it to the data frame, then imported the (single tracking) data with :
> mt_track <- mt_import_long(track, xpos_label = "xpos", ypos_label = "ypos", timestamps_label = "time",
+                            mt_id_label = "ID")
No mt_seq variable found (that indicates the order of the logs). Importing data in sequential order.
which creates a list :
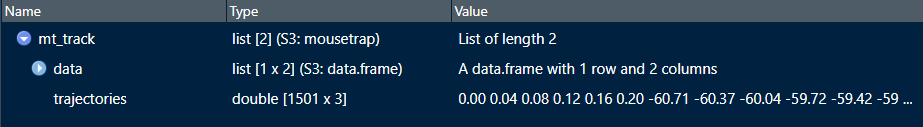
However, that does not seem to be a functional mt object, as
> mt_check_resolution(mt_track)
Error in trajectories[, , timestamps] : incorrect number of dimensions
> mt_plot(mt_track)
Error in dimnames(dataset)[[3]] : subscript out of bounds
What am I doing wrong in this basic first step ?
Best regards,
Michel
Comments
Hi Michel,
Thanks for bringing this up. The code above looks good to me. The edge case of a trajectory dataset that only consists of a single trajectory (which I believe is in practice very rare) may cause issues in some of the mousetrap functions as R by default drops dimensions of arrays which have only one level.
We try to capture this edge case in as many functions as possible, but it seems that we have not captured it yet in
mt_import_long. We will fix this in the next release. For the time being, I would recommend that you create a trajectory dataset with at least two trajectories. You could e.g. do this by simply duplicating the data in your example above and varying the ID variable between the two duplicates.Hope this helps!
Best regards,
Pascal
Thanks, it works with two tracks. Indeed plotting individual traces is not my goal, but in some cases it may be useful to visualize them to check that there is no issue with the tracking.
Hi Michel,
completely agree, visualizing individual trajectories can be very helpful. Mousetrap also offers dedicated functionality for this, i.e., to visualize individual trajectories after you have imported several of them together.:
mt_plot_per_trajectory creates a PDF with one page for each trajectory
mt_plot allows you to provide a subset argument, if you know the specific ID of a trajectory (mousetrap automatically assigns IDs to each trajectory when importing them - they are stort in the mt_id column in data) that you would like to plot, e.g., like this:
mt_plot(mt_example, subset = mt_id == "id01")Best regards,
Pascal