

Beginner's question about distribution plots

Dear everyone,
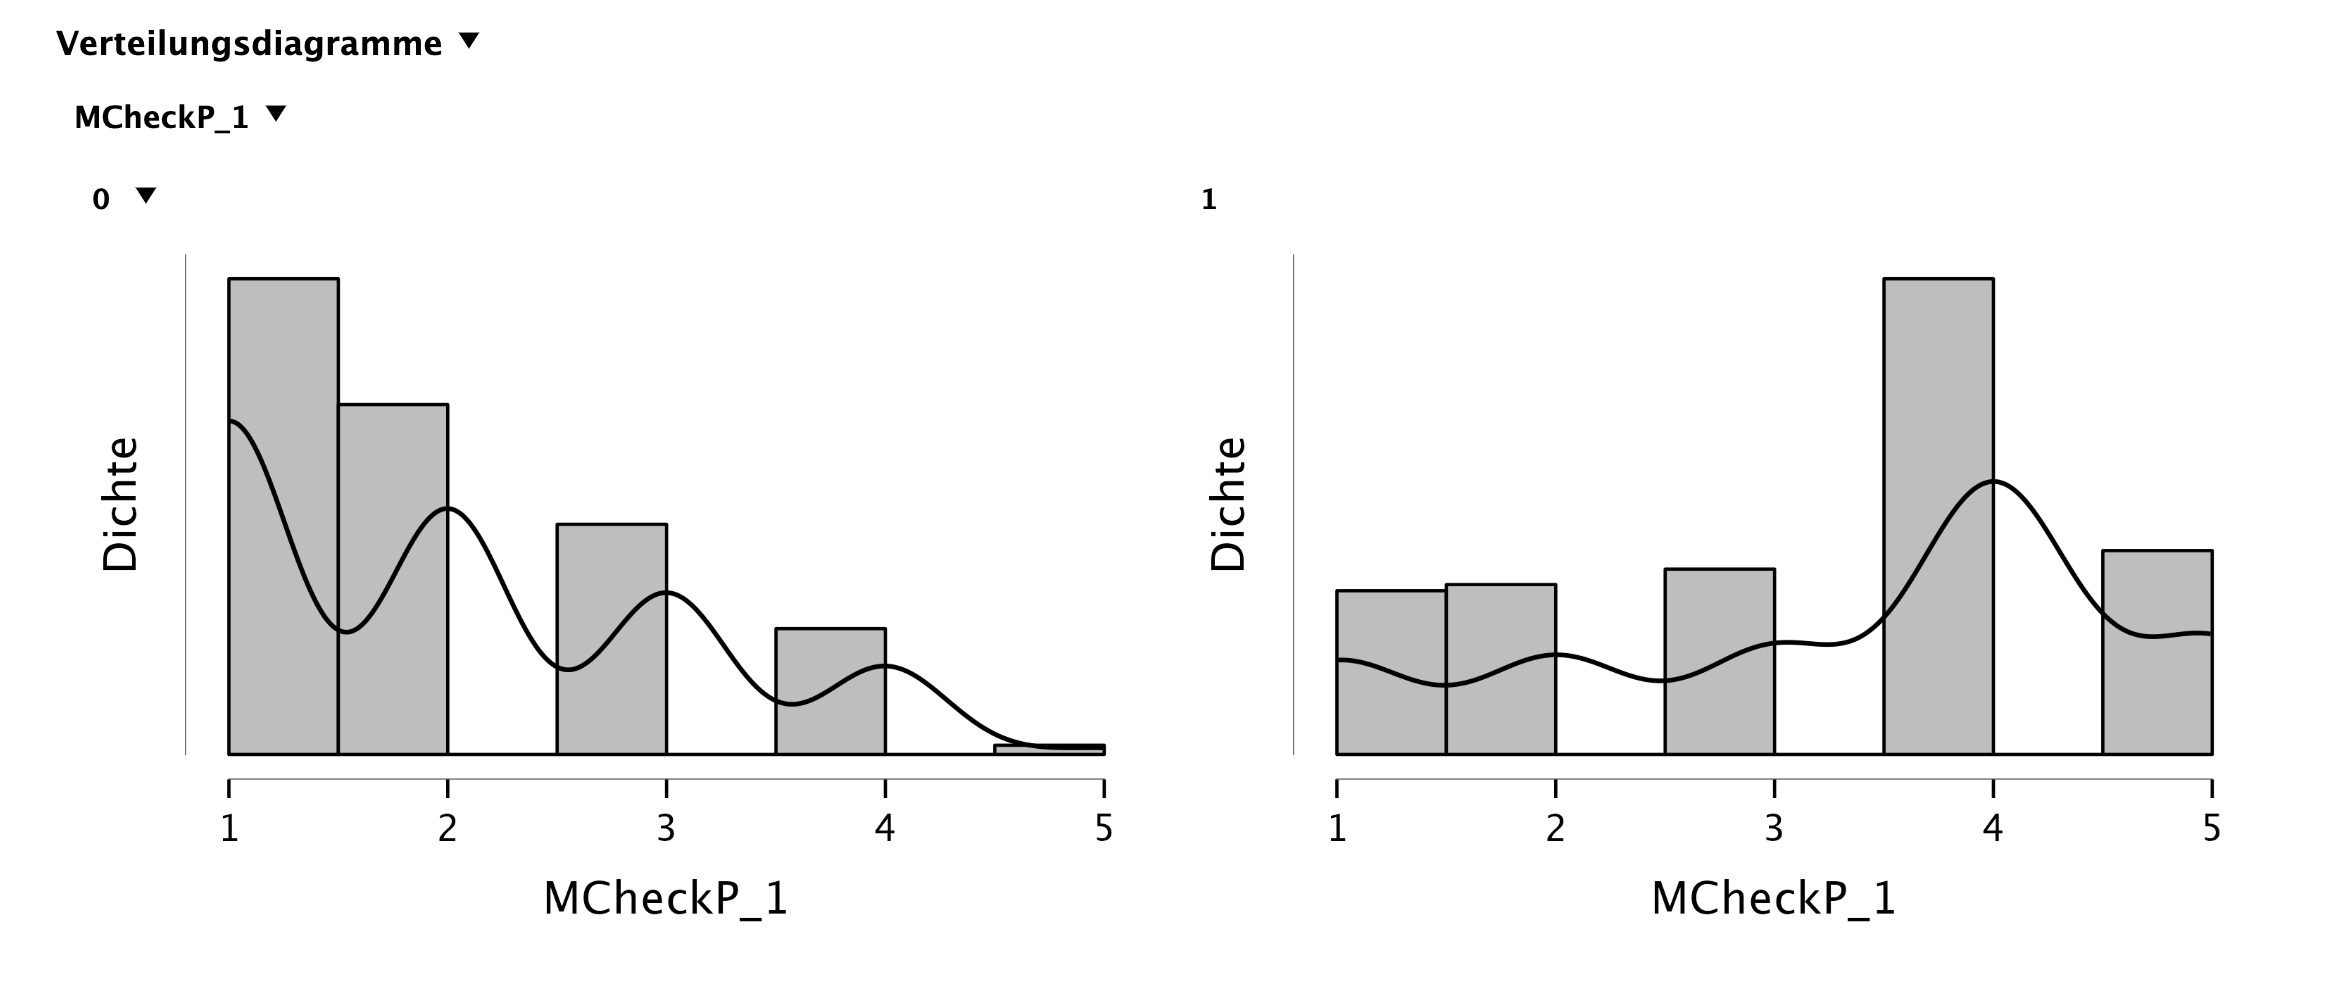
For my BSc thesis, I am working with JASP. I want to include distribution plots, but something weird occurred: There are gaps between the bars despite the data being in lickert-type format (1-5). You can see this in the attached image.
What might be the cause of this?
Thank you very much!
Comments
Difficult to tell without seeing the data. Can you share the anonymized set, or a subset that showcases the problem? I would immediately think that the reason for the strange behavior is that the plot is not really appropriate, as it is not a histogram. I have brought up this important issue with the team. If you want to make the plot that I think you need, try the Visual Modeling module -> Flexplot.
EJ