

Boxplot trajectory

Hey guys,
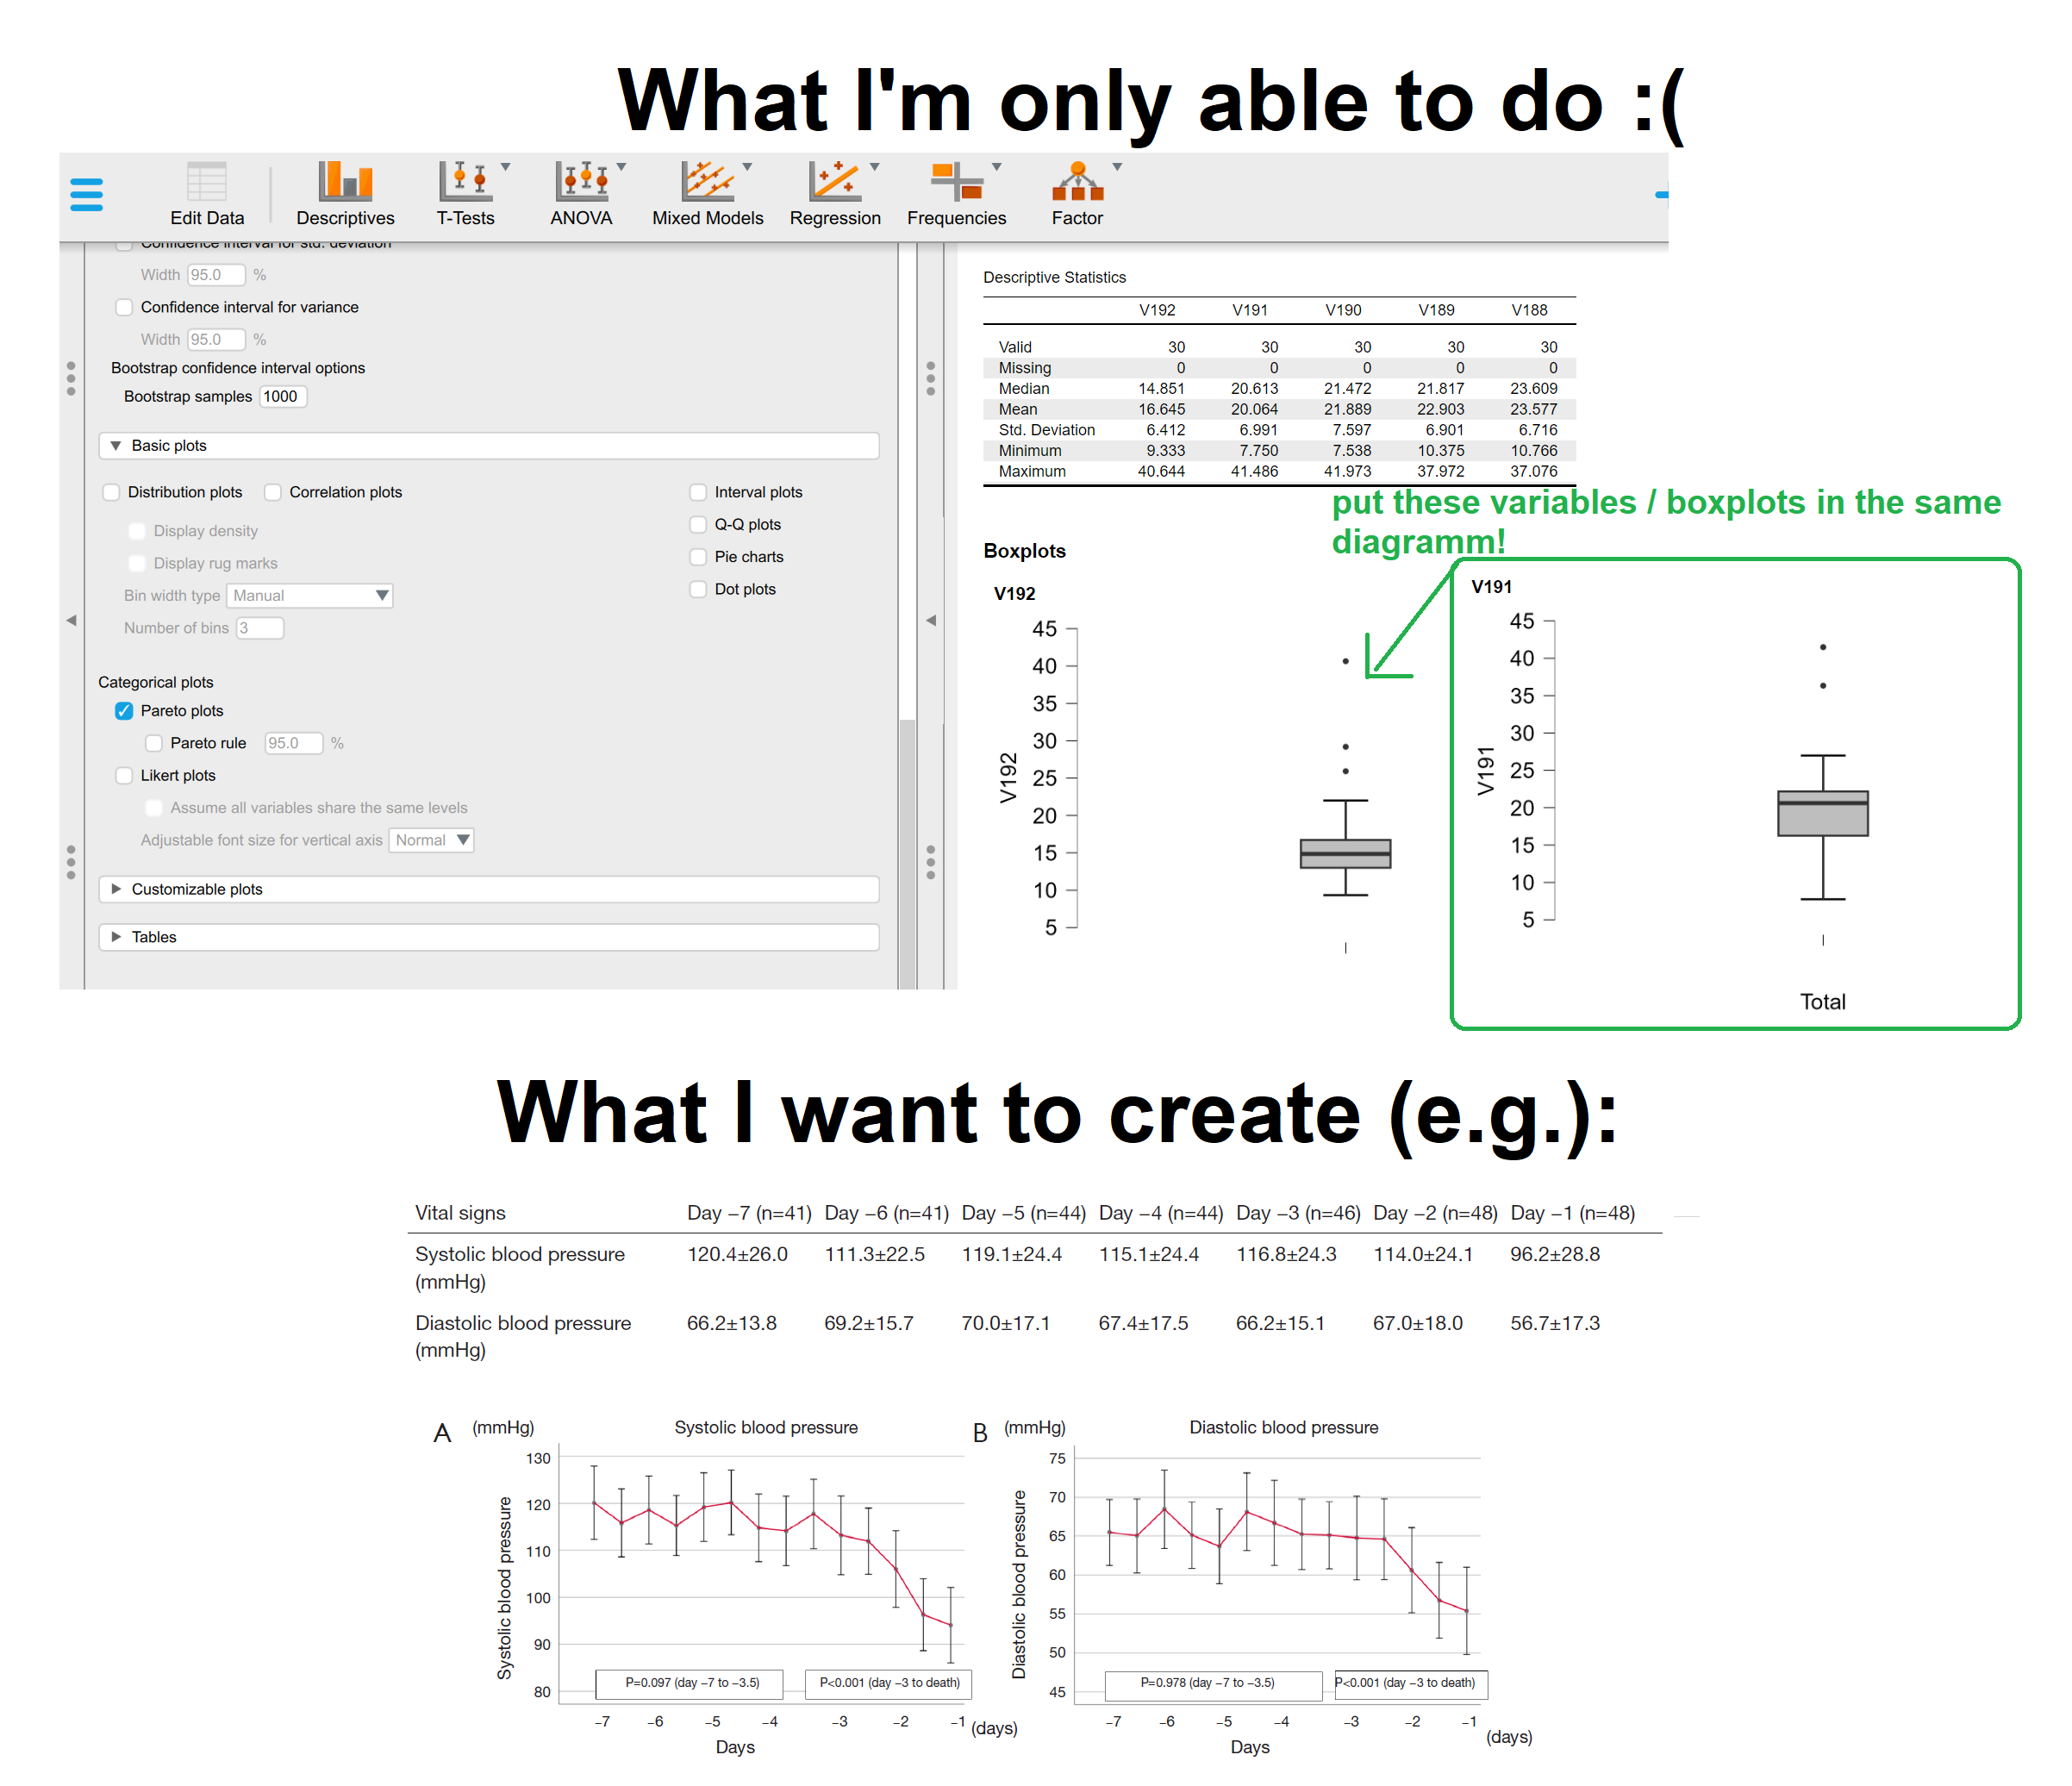
I would like to create a trajectory with multiple variables as boxplots. Is it possible with JASP?
I'm only able to create Boxplots per each variable, but I want them to be on the same diagramm ==>
x axis: variables (e.g. v192, v191 ...) [equal to time in hours]
y axis: boxplot with 'mean' and 'sd'
Better explanation in the following picture!
Thanks in advance for your help :)
Sebastian
Comments
Hi Sebastian,
yes, this recently became possible!
You have two options on how to do this.
Your first option is to wait for the next official JASP release (0.19).
The release should be in about three or four weeks.
If you want to share your work, or even load it with some other version of JASP, then you should wait for this official release.
There is, however, a second option, if its really urgent for you or if you want to create a sketch/work-in-progress plot, while you wait for verson 0.19.
Go to https://static.jasp-stats.org/Nightlies/
and download the lastest Nighly for your system; for example this one:
I think its best if you install it under a slightly different name, so you do not mess up you other work in JASP 0.18. Even better if you back up everything you have been working on beforehand!
Afterwards, you can go to the Descriptives Module and select the new submodule: "Raincloud Plots".
Then, you can select one dependent variable. So, your V192, V191, etc. should be a levels of a factor (primary factor) and their values should all go in one column "name of dependent variable column".
In other words, your dataframe should be in long format!
Afterwards you can uncheck "Show Point" and "Show Violin" in section "Cloud Elements".
You should see all boxplots next to each other.
If you want a line connecting the boxplots, then this is currently only possible with a work-around:
Check "Mean" in section "Advanced" and "Connect means with lines".
Here is what that it should look like:
(I used the penguins dataset from the JASP Data Library; 10. Machine Learning.)
You will see, that the Raincloud Plots module comes with a bunch of different features.
We have also planned to release a youtube tutorial, that showcases and explains all the features.
Best,
Vincent from the JASP Team
Hey,
thank you Vincent!
I'll wait for the new JASP-Version und will try it then :)
Best,
Sebastian