

Network analysis -- Bootstrapping

Hi everyone,
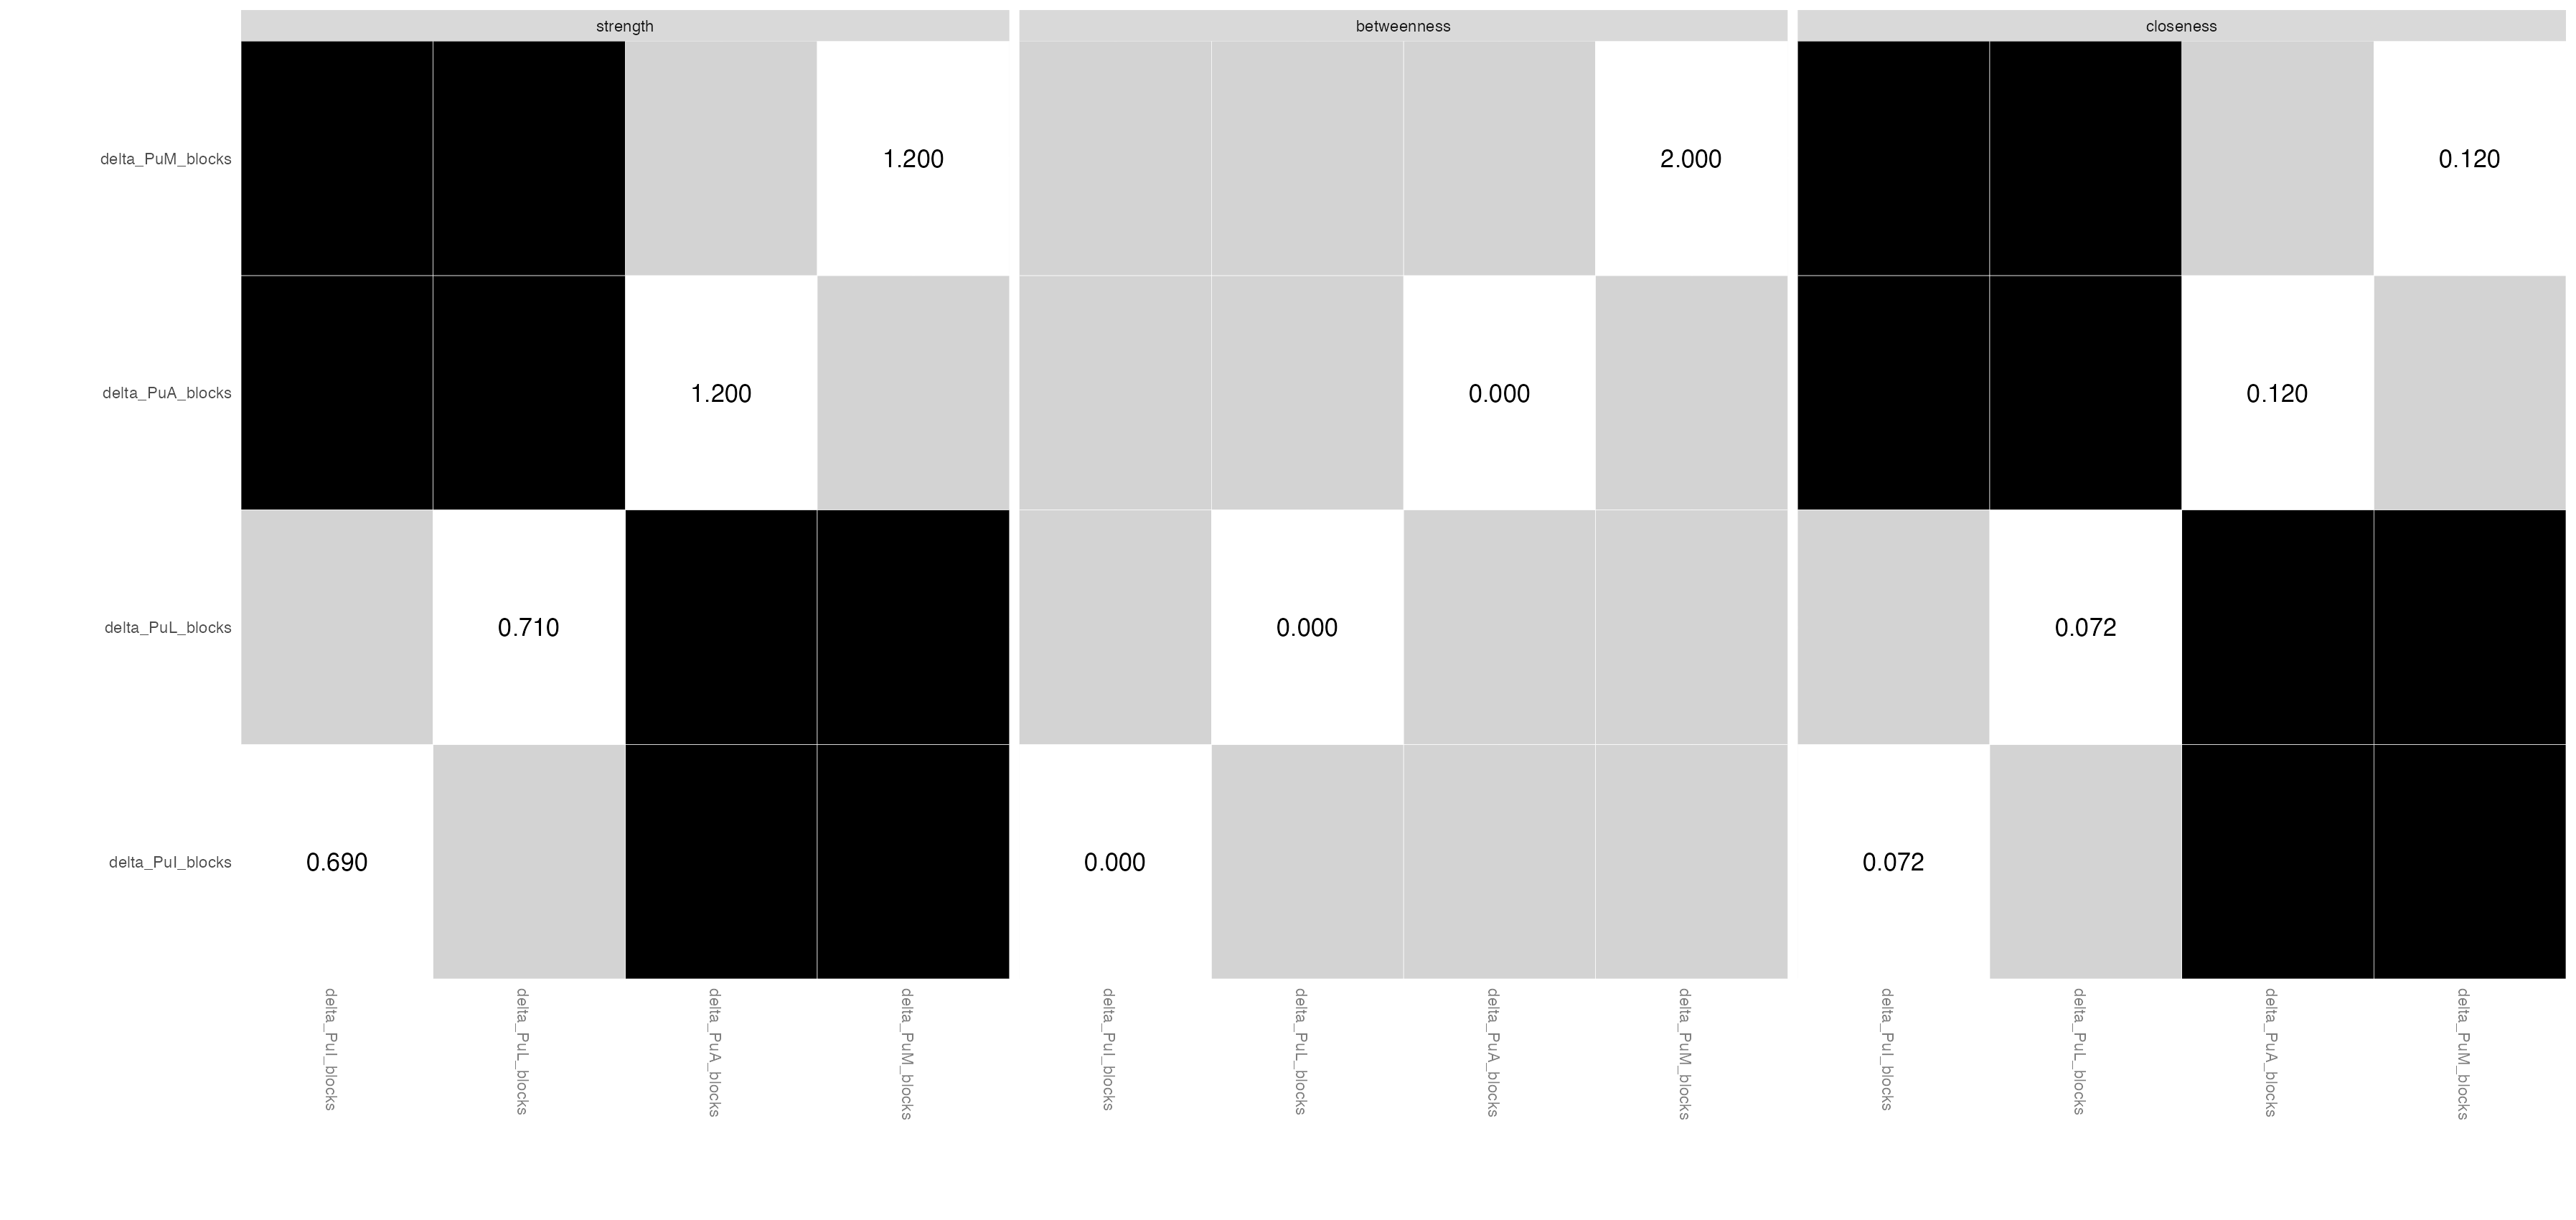
I'm trying to understand the black-gray-white output I got when bootstrapping the centrality measures of network analysis. I'm aware of two tutorials recommended in this forum but still, I don't understand how to interpret my results. The output shows a matrix of each node with all other nodes. Black color indicates significant difference while gray indicates nonsignificant results. But what that means?
Let's say there are two nodes A and B. Does the output represent this process:
1) Deference between the observed A and observed B.
2) Deference between the bootstrapped A and bootstrapped B.
3) Creating a distribution of 2.
4) Comparing the place of 1 on the distribution of 3 and decide if it's significant or not.
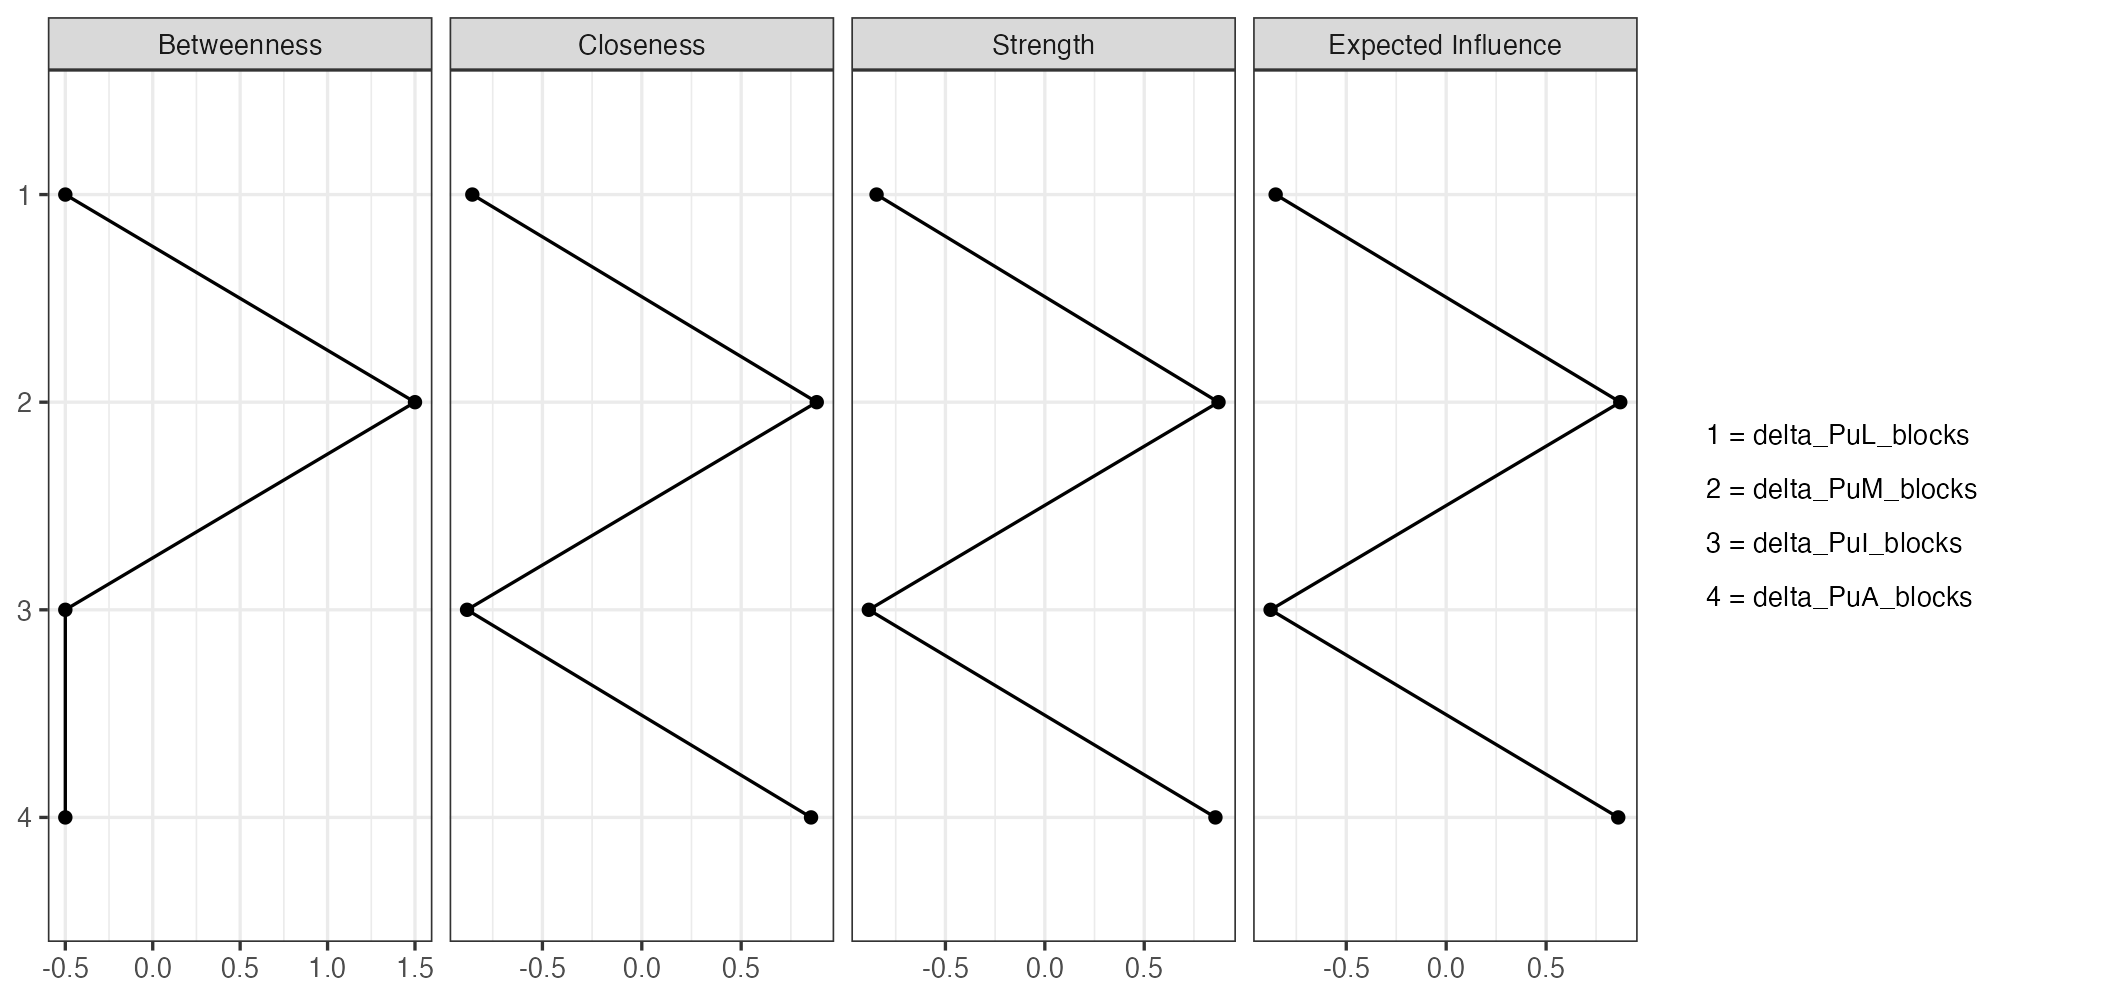
If this is the case, that means, black squares are unstable and gray squares are stables? -- but this doesn't make sense to my results. Please see the attached Table 1 shows that nodes 2 and 4 have stronger centrality measures in the network. However, the bootstrapping shows that the difference between node 4 and: 1 & 2 is not stable. This doesn't make sense to me. I think my interpretation of the results is not correct.
Please let me know what you think and how to understand these outputs.
Thank you so much,
Muhammad Badarnee
Comments
I've asked the team
Cheers,
E.J.
Hi,
What happens is that
Note that in the two screenshots, the order of the nodes is not the same. In the centrality plot, it's
whereas in the bootstrapped plot it is
If I look at the centrality plot (either closeness or strength) then it looks like nodes 1 & 3 differ from 2 and 4. This is corroborated by the bootstrap result. It appears as if there is also a difference in betweenness among the nodes (e.g., node 2 vs the rest), but the bootstrap confidence interval does include zero, so this difference is not significant.
Hope that helps,
Don
Thank you EJ and Don for clarifying this point. I wonder if there is an option to extract the actual values of the 95% CIs of the bootstrapped distribution of the differences between each pair of nodes.
Thank you,
Muhammad.