

Clinched x axis when creating a single plot with separate lines

Hi everyone,
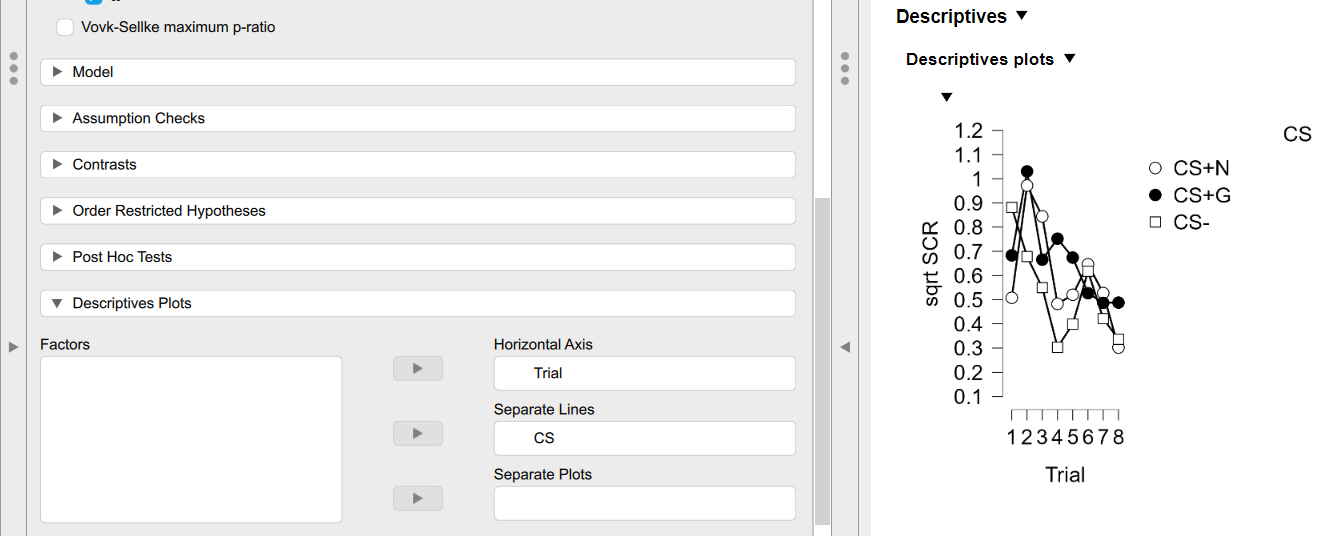
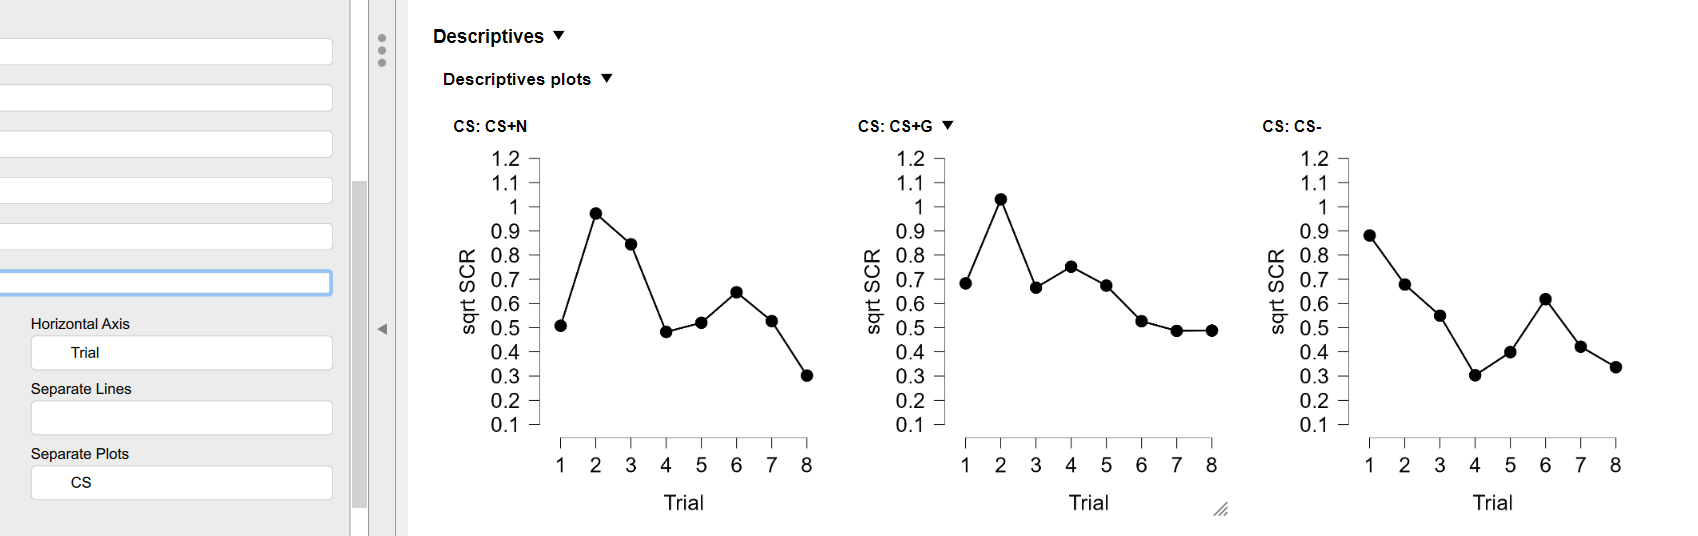
I would like to create a single plot with seperate lines representing different stimuli presented during my experiment but whenever I do this, the x axis gets clinched. When I create seperate plots, the x axis looks fine. Does anyone know a solution to this? I'll attach screenshots to illustrate this.
Thank you in advance!!
Comments
For the single plot, you can drag the little triangular handle (that appears below the figure) to the right, to elongate the x axis. (Note: The last time I checked, this action produced a temporary rather than lasting change. That is, if you save and then re-open the file, the x axis reverts to its non-elongated state.)
R
Thanks for the quick response! That unfortunately elongates not just the x axis but the whole graph, though ._.
It only elongates the x axis (It does not distort text, etc). Initially it looks like everything is stretched, but that fixes itself in a few seconds.
R
Ooh yes, guess I was too impatient then, I never waited. Thanks again!!